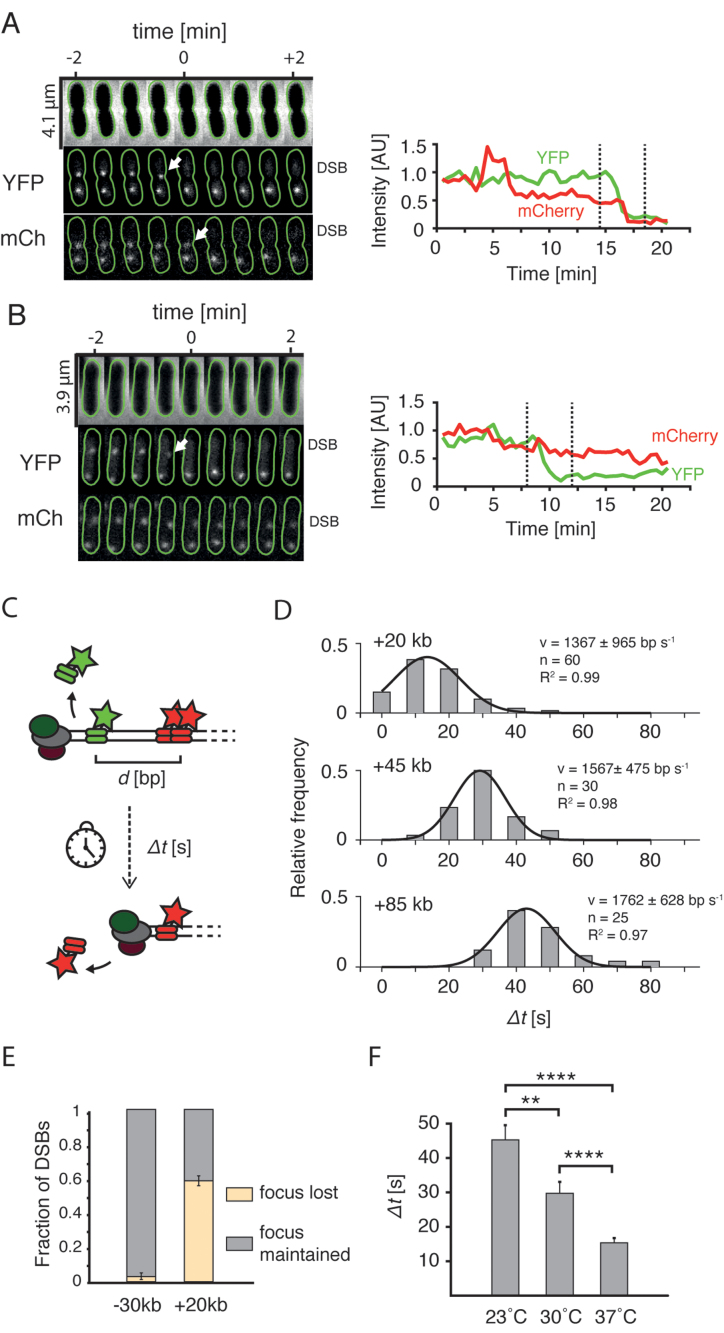
Figure 2.
End resection in live cells. (A) Cell in which loss of the YFP focus is linked to the disappearance of mCherry focus. Top: phase contrast channel; middle: +1.5 kb marker in the YFP channel; bottom: +20 kb marker in the mCherry channel. Green lines show cell outlines obtained using Oufti software (20). Arrows point at the events of disappearance of foci. Plots on the right represent integrated intensity of the labeled DSB. Dashed lines mark the time-interval shown on microscopy montage on right. (B) Example cell in which the loss of the YFP focus was not linked to the loss of the mCherry focus. (C) Experimental procedure to measure the speed of resection with the two-color assay. The time between the events of loss of two foci (Δt) divided by the genetic distance (d) yields an average speed of resection. (D) Histograms of processing times (Δt) measured for cells with +20, +45 and +85 kb markers. Black lines represent Gaussian fits to the experimental data. Goodness of fit, number of data points, and calculated mean (±SD) are shown. (E) Fraction (mean ± SD; −30 kb: n = 61; +20 kb: n = 46) of DSBs in which the mCherry foci were lost, or maintained after the YFP focus was displaced. (F) Mean processing times in cells with +20 kb measured at different temperatures (mean ± SEM, 23°C: n = 40; 30°C: n = 40; 37°C: n = 60).

