Figure 4.
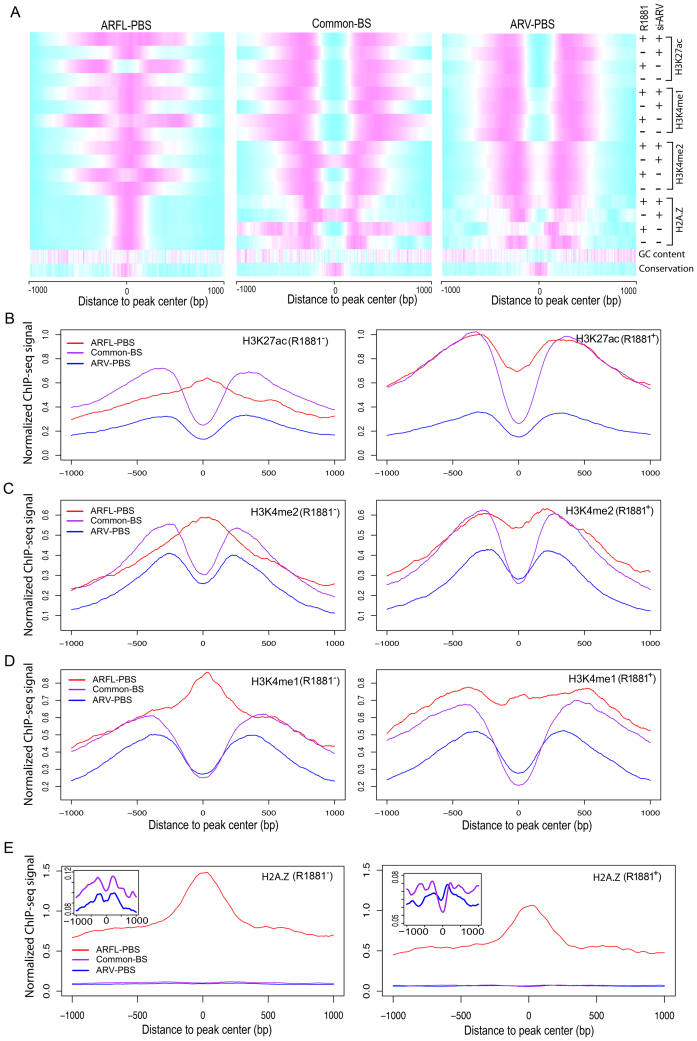
Epigenome landscapes of ARV-PBS, ARFL-PBS and Common-BS. (A) Heatmaps showing normalized read intensities for histone modification ChIP-seq and histone variant H2A.Z ChIP-seq at ARFL-PBS, Common-BS and ARV-PBS. Magenta and cyan indicate high and low read intensities, respectively. (B–E) H3K27ac, H3K4me2, H3K4me1 and histone variant H2A.Z ChIP-seq signal profiles for ARFL-PBS (red), Common-BS (purple) and ARV-PBS (blue) in 22Rv1 cells without (left) or with (right) R1881 (methyltrienolone) treatment. Zoom-in views of the y-axis for common-BS and ARV-PBS were displayed on the top-left corner of the panel (E).

