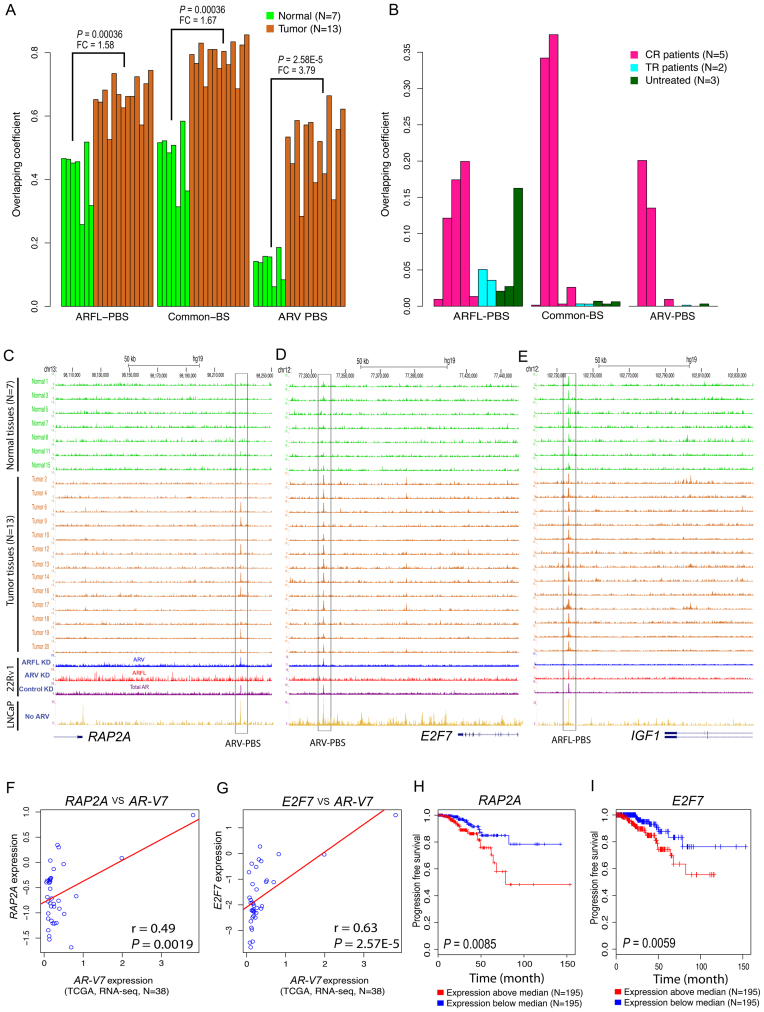
Figure 5.
Analysis of ARFL-PBS, Common-PBS and ARV-PBS in prostate cancer patient specimens. (A) Overlap of ARFL-PBS, Common-PBS, and ARV-PBS with AR binding sites identified from seven normal prostate epithelium tissues (green) and 13 prostate tumor tissues (chocolate). The AR ChIP-seq data in 20 men were downloaded from GEO with accession number GSE56288. (B) Overlap of ARFL-PBS, Common-BS, and ARV-PBS with AR binding sites identified from 5 castration resistant (CR) prostate cancer tissues (deep pink), 2 treatment responsive (TR) prostate tumor tissues (cyan) and 3 untreated (UT) prostate tumor tissues (dark green). The AR ChIP-seq data in 10 men were downloaded from GEO with accession number GSE28219. The overlapping coefficient is defined as the number of the overlapped peaks divided by the smaller size of the two lists of peaks. (C–E) UCSC tracks showing AR ChIP-seq signal profiles in 7 normal (green), 13 prostate tumor tissues (chocolate), 22Rv1 (ARFL-specific KD, ARV-specific KD or control non-specific KD) and LNCaP cells at the RAP2A (C), E2F7 (D) and IGF1 loci (E). KD, knockdown. (F and G) Association of ARV7 with RAP2A (F) or E2F7 (G) expressions in 38 TCGA samples with detectable ARV7 expression. (H and I) Kaplan–Meier survival curves for RAP2A and E2F7 using 390 TCGA samples. Y-axis, the probability of recurrence free survival; X-axis, time in month. Red curves, overexpression; blue curves, low expression.

