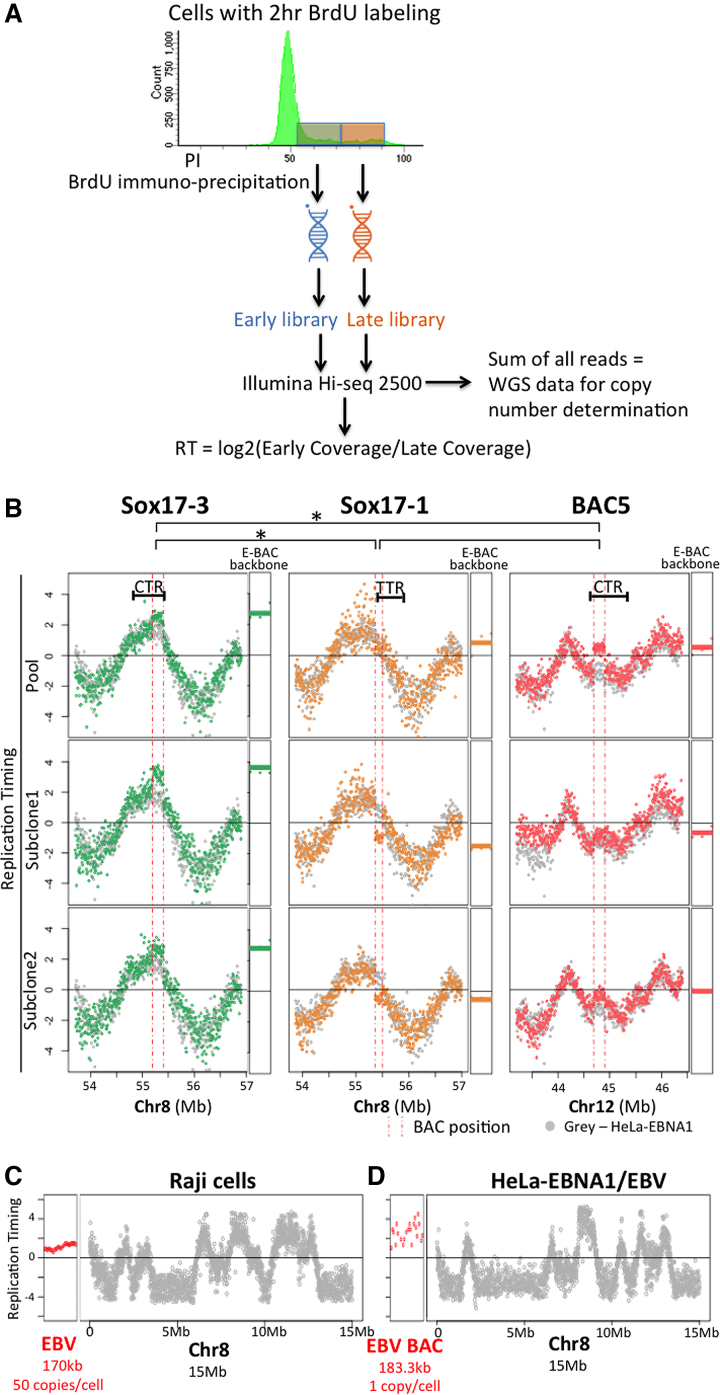
Figure 4.
E-BAC replication timing. (A) Experimental flowchart for Repli-seq. Exponentially growing cells were labeled with BrdU for 2 h, sorted for DNA content into early versus late S phase. DNA was isolated, sheared and the nascent DNA synthesized either early or late during S phase was immunoprecipitated with an anti-BrdU antibody. BrdU-substituted DNA was sequenced and the log2 ratio of sequences in early versus late S phase fractions was calculated in 6 kb non-overlapping windows. To determine copy number, the reads from early and late fractions were summed to acquire whole genome sequencing information and the total number of reads per 6kb window was determined (see Figure 3B and Materials and Methods). (B) E-BAC repli-seq profiles. The Y-axis for each data point is the log2 ratio for reads within a 6 kb window. HeLa-EBNA1 cells without E-BAC transfection were used as control (gray data points). Vertical pink dashed lines indicate the human chromosomal map positions of the segments contained in each BAC. RT of the 21 kb bacterial sequences of each E-BAC (pBACe3.6 E-BAC backbone) was plotted separately and indicated as horizontal lines (average of all 6kb windows) next to the chromosomal regions. (C, D) Replication timing of the EBV genome in Raji cells (C) and the EBV BAC in HeLa-EBNA1/EBV (D) (red data points). The datapoints for HeLa-EBNA1 EBV BAC are more dispersed because there are fewer total reads due to the substantially lower copy number of the EBV sequences in this cell line (Supplementary Figure S9). Data from 15 Mb of chr8 is plotted for comparison (grey data points).

