Figure 5.
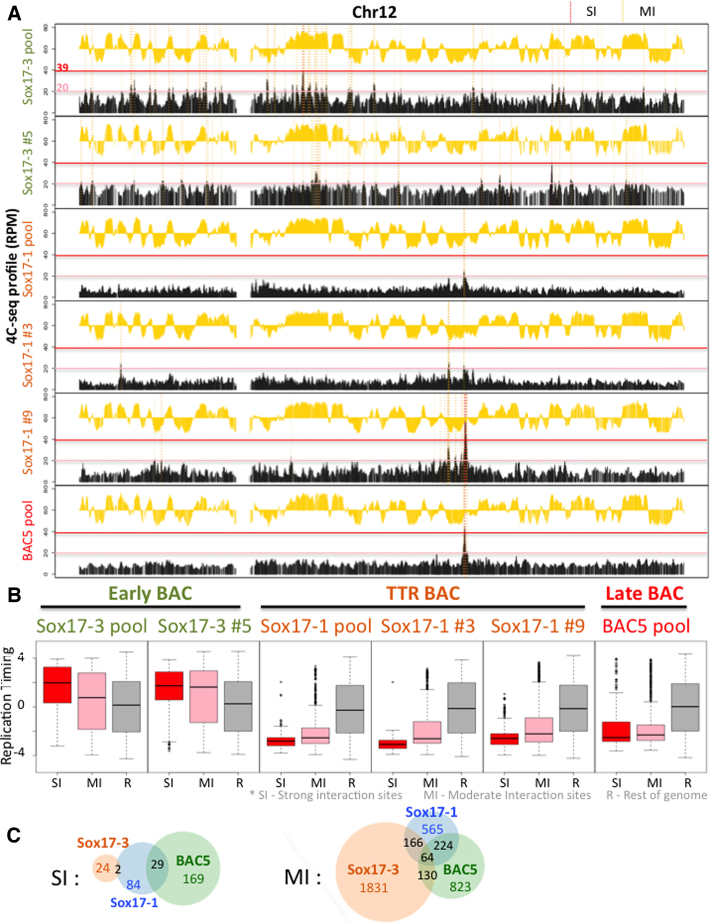
E-BAC compartment analysis. 4C-seq was performed using a bait on the pBACe3.6 plasmid backbone. (A) Exemplary 4C-seq and repli-seq profiles for chr12 are plotted as a black or yellow histogram, respectively. Strong Interaction sites (SIs) with reads between 39 to 400 RPM, and Moderate Interaction site (MIs) with reads between 20 and 39 RPM, are shaded by red or yellow dashed vertical lines, respectively, demonstrating how the strong and moderate interaction sites were defined for B and C. The red and pink horizontal lines indicate the y-axis positions of the SI and MI cut-offs. (B) Boxplots demonstrate RT distribution of E-BAC Strong Interaction sites (SI, red box), Moderate Interaction sites (MI, pink box) and the rest of genome as control (R, gray box) for all three pools and Sox17-3 subclone 5 (Sox17-3 #5), Sox17-1 clones 3 and 9 (Sox17-1 #3 and #9). (C) Venn diagram shows the number of shared SI or MI sites (50kb windows) in 4C-seq profiles of Sox17-3, Sox17-1 and BAC5 pool.

