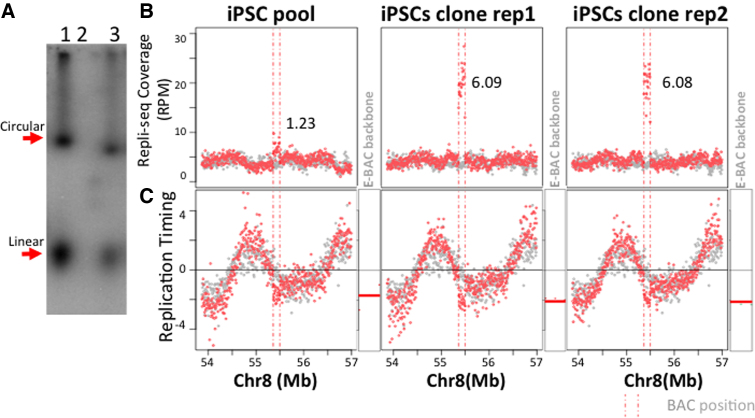
Figure 6.
Replication timing of sox17-1 E-BAC in K3-EBNA1 hiPSCs. (A) Gardella gel result for Sox17-1 E-BAC transfected K3-EBNA1 pool. Lane 1: Sox17-1 E-BAC transfected HeLa-EBNA1 cells; Lane 2: K3-EBNA1 cells; Lane 3: Sox17-1 E-BAC transfected K3-EBNA1 pool. (B) Repli-seq read coverage for E-BAC regions. The numbers on each plot represent copy number estimation of Sox17-1 E-BAC (see Materials and Methods). K3-EBNA1 without E-BAC transfection was used as control (grey data points). (C) E-BAC replication timing in K3-EBNA1 cells. Log2 ratio of early to late coverage of K3-EBNA1 with sox17-1 E-BAC was plotted (red data points) as compared to K3-EBNA1 cells as control (gray data points). Vertical pink dashed lines indicate the Sox17-1 BAC corresponding position on chr8. RT of the 21 kb bacterial sequences of each E-BAC (pBAC3.6 E-BAC backbone) was plotted separately and indicated as horizontal lines next to the chromosomal regions (as in Figure 4B).

