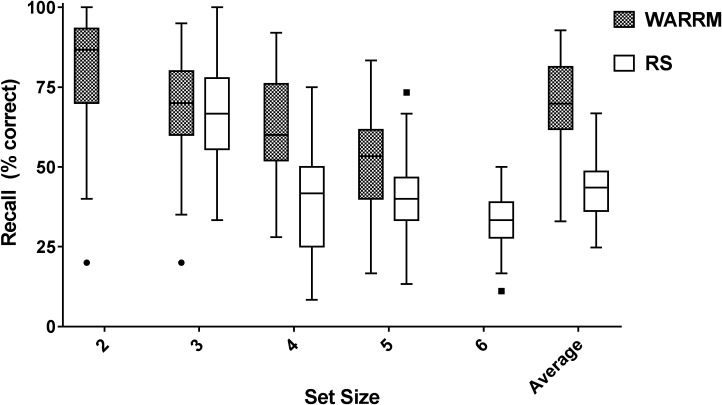
Figure 3.
Box and whisker plot showing recall (percent correct) on both working memory tests, Word Auditory Recognition and Recall Measure (WARRM) and reading span measure (RS) across set sizes. Lines in the boxes represent the median, boxes represent the 25–75 percentiles, and the whiskers are the Tukey range, with filled circles representing potential outliers.

