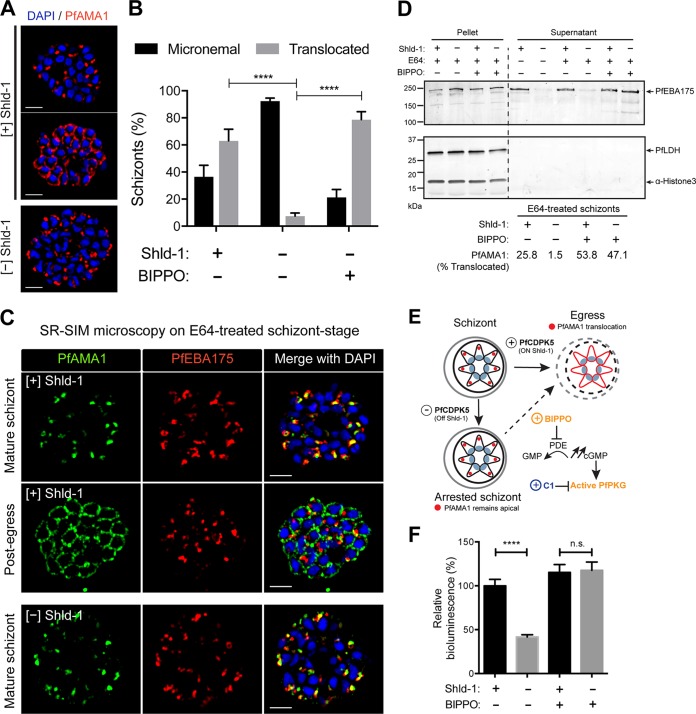
FIG 3 .
PfAMA1 translocation and egress in 3D7-PfCDPK5DDKnL parasites. (A) SR-SIM IFA of [+] Shld-1 schizonts or [−] Shld-1 schizonts probed with anti-PfAMA1 antibodies. Representative parasites with micronemal and translocated PfAMA1 are shown. Bars, 2 µm. (B) Quantification of each localization by wide-field IFA from [+] or [−] Shld-1 schizonts and from [−] Shld-1 schizonts treated with 2 µM BIPPO shown on the graph. Values are means plus standard deviations (SD) (error bars). Three biological replicates and 100 schizonts were counted per replicate. Values that were significantly different (P < 0.0001) by one-way analysis of variance (ANOVA) are indicated by bars and four asterisks. (C) SR-SIM IFAs performed on [+] Shld-1 and [−] Shld-1 3D7-PfCDPK5DDKnL schizonts demonstrating that the localization of PfEBA175 was not different in pre- and post-“egress trigger” [+] Shld-1 schizonts or in [−] Shld-1 schizonts. (D) Immunoblot analysis of PfEBA175 processing. [+] and [−] Shld-1 schizonts were treated with (+) or without (−) BIPPO. Equivalent amounts of schizont lysate and supernatant were subjected to immunoblot analysis with anti-PfEBA175, anti-PfLDH (loading control), and anti-H3 (α-Histone 3) (additional loading control) antibodies. In one set of supernatant samples, the schizonts were allowed to egress naturally without E64. The percentage of schizonts with translocated PfAMA1 is displayed below the immunoblot (similar to panel B, 100 schizonts counted per condition). (E) Schematic showing the effects of Shld-1, BIPPO, and compound 1 (C1) on PfAMA1 translocation. PDE, phosphodiesterase. (F) Quantification of bioluminescence in supernatant from [+] or [−] Shld-1 parasites at 50 h.p.i. with or without BIPPO treatment 90 min prior to measurement. Three biological replicates each done with technical triplicates were performed. Values are means ± SD (error bars). Values that are significantly different (P < 0.0001) by one-way ANOVA are indicated by a bar and four asterisks. Values that are not significantly different by one-way ANOVA (n.s.) are also indicated.

