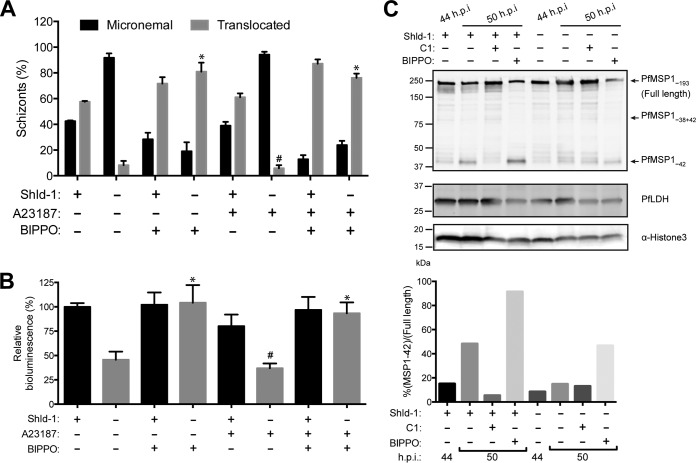
FIG 4 .
Calcium and cGMP signaling pathways in 3D7-PfCDPK5DDKnL parasites. (A) PfAMA1 translocation was visualized by wide-field IFA from [+] Shld-1 or [−] Shld-1 parasites treated with 1 µM A23187 and/or 2 µM BIPPO as indicated. Three biological replicates were performed, and 100 schizonts counted per replicate. Values are means plus SD (error bars). The percentage translocated from the small-molecule-treated [−] Shld1 samples was compared to the value for the untreated [−] Shld1 condition by one-way ANOVA. Values that were significantly different (P < 0.001) by one-way ANOVA are indicated by an asterisk. Values that were not significantly different (#) by one-way ANOVA are also indicated. (B) Bioluminescence activity released in culture supernatants from the same conditions as in panel A (three biological replicates each done with technical triplicates; mean ± SD). Each of the [−] Shld1 with small-molecule treatments was compared to the untreated [−] Shld1 condition by one-way ANOVA (*, P < 0.001; #, not significantly different). (C) 44 h.p.i. schizonts from [+] or [−] Shld-1 parasites were isolated by magnetic purification and lysed immediately or incubated for an 6 additional hours with the indicated compounds prior to lysis. Protein lysates were subjected to immunoblot analysis with anti-PfMSP142, anti-PfLDH (loading control), and anti-H3 (additional loading control) antibodies. Full-length, partially processed, and fully processed PfMSP142 are labeled. The quantitative ratio of fully processed PfMSP142 relative to the unprocessed form was calculated by volumetric measurement of fluorescence intensity with the Li-Cor Odyssey CLx system.

