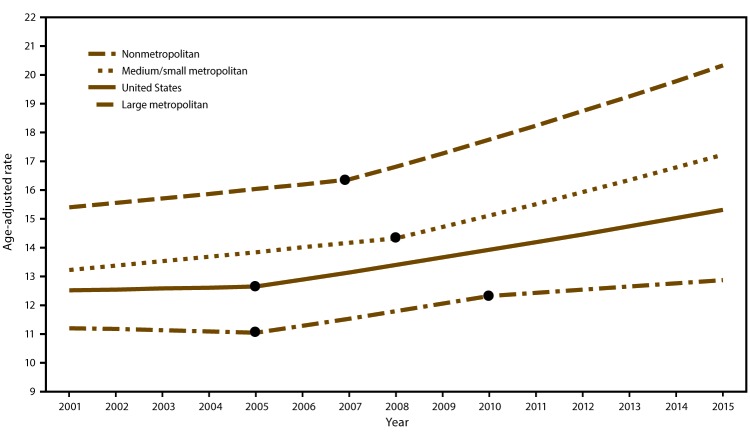
FIGURE 1.
Suicide rates* among persons aged ≥10 years, by county urbanization level† — United States, 2001–2015§
* Per 100,000 residents aged ≥10 years, age adjusted to the 2000 U.S. standard population.
† Levels of urbanization were collapsed using the 2006 National Center for Health Statistics urban classification scheme. The six classification levels for counties are 1) large central metropolitan (part of a metropolitan statistical area with ≥1 million population and includes a principal city); 2) large fringe metropolitan (part of a metropolitan statistical area with ≥1 million population but does not include a principal city); 3) medium metropolitan (part of a metropolitan statistical area with ≥250,000 but <1 million population); 4) small metropolitan (part of a metropolitan statistical area with <250,000 population); 5) micropolitan (nonmetropolitan) (part of a micropolitan statistical area [has an urban cluster of ≥10,000 but <50,000 population]); and 6) noncore (nonmetropolitan) (not part of a metropolitan or micropolitan statistical area). Large metropolitan includes counties from large central metropolitan and large fringe metropolitan areas. Medium/small metropolitan includes counties from medium metropolitan and small metropolitan areas. Nonmetropolitan includes counties from micropolitan and noncore areas.
§ Joinpoint regression analysis was used to determine annual percentage change with statistically significant trend (p<0.05). Dots indicate the joinpoints.

