. 2017 Oct 6;66(18):1–16. doi: 10.15585/mmwr.ss6618a1

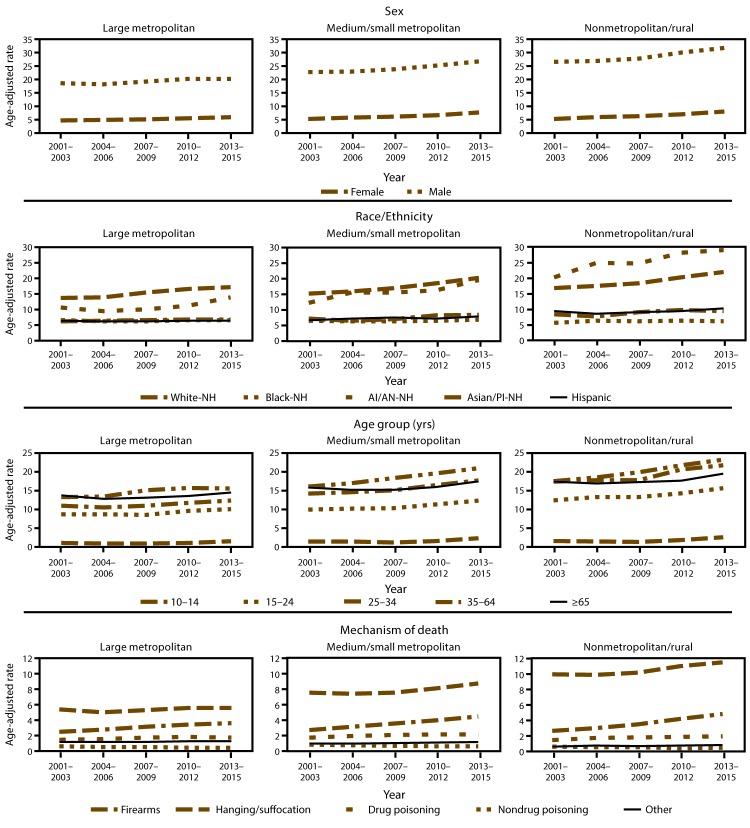
FIGURE 2.

The figure includes a series of line graphs indicating age-adjusted suicide rates per 100,000 population among persons aged ≥10 years by county urbanization level in the United States during 2001 to 2015. Rates are indicated for age, sex, race/ethnicity, and mechanism of death. Urbanization levels are nonmetropolitan/rural, small/medium metropolitan, and large metropolitan. Age groups are 10 to 14 years, 15 to 25 years, 25 to 35 years, 35 to 64 years, and ≥65 years. Racial/ethnic groups are non-Hispanic white, non-Hispanic black, non-Hispanic American Indian/Alaska Native, non-Hispanic Asian/Pacific Islander, and Hispanic. Mechanisms of death are firearms, hanging/suffocation, drug poisoning, nondrug poisoning, and other.

Suicide rates* for selected characteristics among persons aged ≥10 years, by county urbanization level — United States, 2001–2015

Abbreviations: AI/AN = American Indian/Alaska Native; NH = non-Hispanic; PI = Pacific Islander.

* Per 100,000 residents aged ≥10 years, age adjusted to the 2000 U.S. standard population.