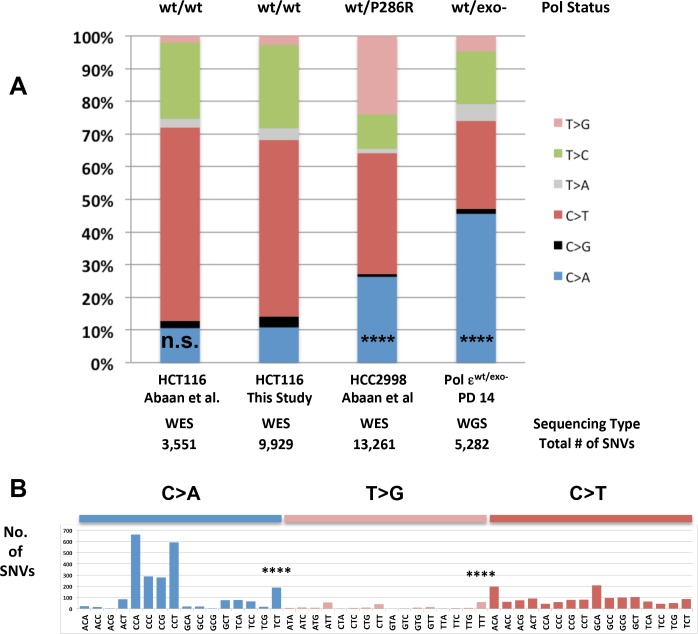
Figure 2. Whole-genome sequencing from defined population doubling Pol εwt/exo- mismatch repair-deficient cells.
(A) Whole genome sequencing (2.8 × 10⁹ bp, average 30X coverage) was performed on Pol εwt/exo- cells lacking mismatch repair at two defined population doubling levels, P0 and P14, as described in the Methods. P0 was used as the matched normal cells to define only those mutations arising during the 14 population doublings. The fraction of each type of base pair substitution from the PD 14 Pol εwt/exo- cells was plotted and compared to the fraction of each type of mutation from HCT116 ((Abaan et al., 2013) and this study) and HCC2998 cells (Abaan et al., 2013). Chi square tests with Yates correction were used to calculate p values relative to SNVs found in Pol εwt/wt mismatch repair-deficient cells in this study. Pol εwt/wt (Abaan et al.) χ2 = 0.033, p=0.8551; Pol εwt/P286R (Abaan et al.) χ2 = 872.341, p<0.0001; Pol εwt/exo-χ2 = 2,3680.508, p<0.0001. ****p<0.0001; n.s., not significant. (B) The number of each indicated base pair substitution in a specific trinucleotide context was plotted from the PD 14 Pol εwt/exo- mismatch repair-deficient cells. The base pair substitutions shown (C > A and T > G transversions, left; C > T transitions, right) are those found enriched in POLE tumors. Chi square tests with Yates correction were used to calculate p-values relative to SNVs found in Pol εwt/wt mismatch repair-deficient cells in this study. C > A TCT χ2 = 152.772, p<0.0001; T > G TTT χ2 = 72.254, p<0.0001. ****p<0.0001.
Figure 2—figure supplement 1. Whole genome SNVs identified in Pol εwt/exo- (PDL = 14) in cells lacking functional mismatch repair identified.
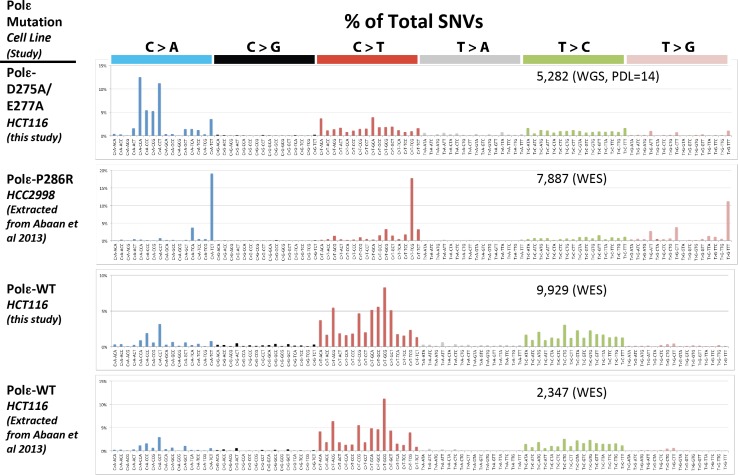
Figure 2—figure supplement 2. POLE mutation signature extracted from POLE-mutant cell lines.
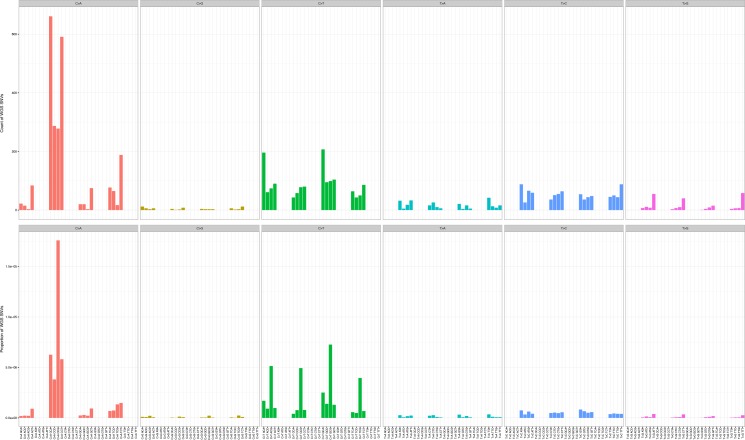
Figure 2—figure supplement 3. Mutation counts in the indicated trinucleotide context (top) were plotted as a proportion of their occurrence (bottom) in WGS samples.
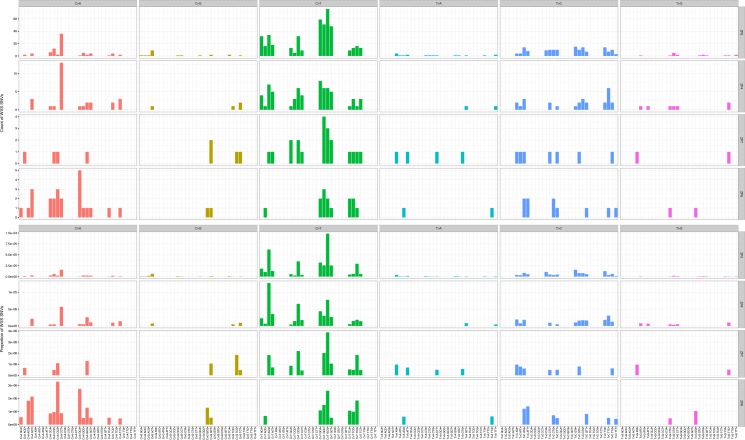
Figure 2—figure supplement 4. Mutation counts in the indicated trinucleotide context (top) were plotted as a proportion of their occurrence (bottom) in WES samples.
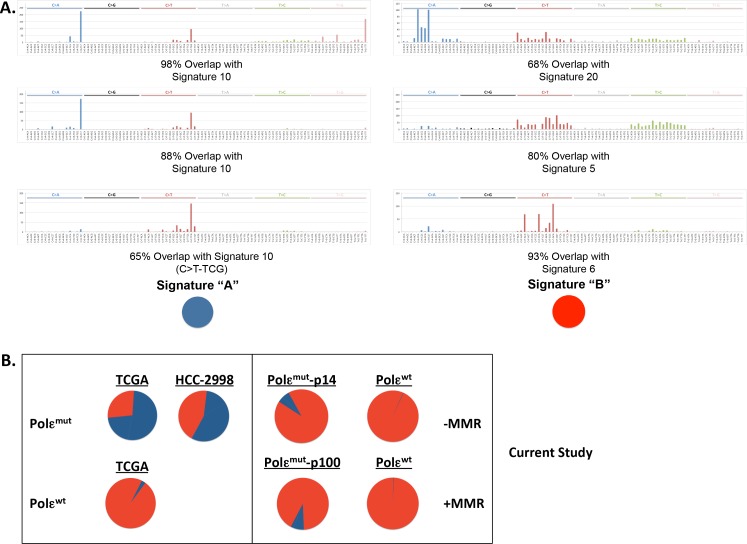
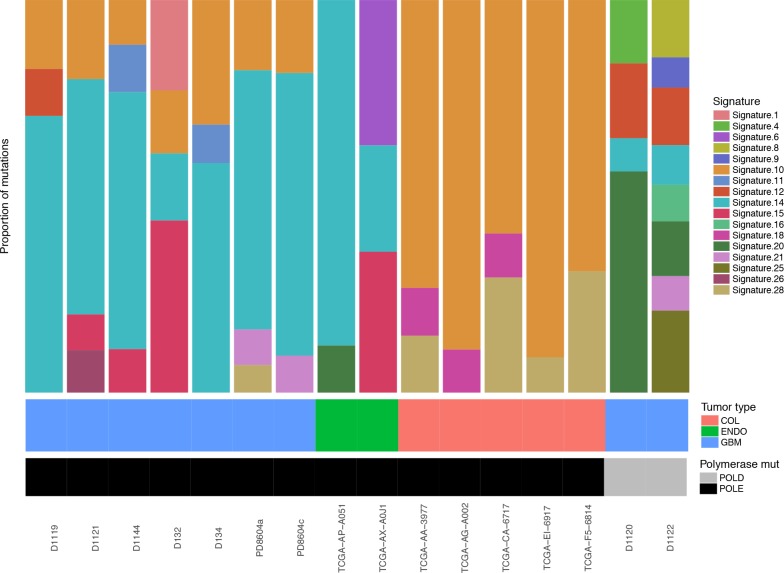
Figure 2—figure supplement 5. Relative contributions of Cosmic Mutation Signatures to individual patient mutation spectra were determined using deconstructSig.
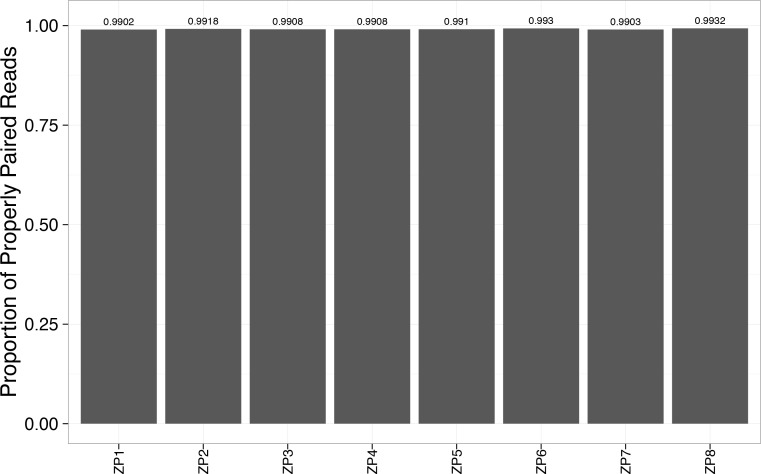
Figure 2—figure supplement 7. Alignment rate to the reference genome exceeded 99% for each WES sample.
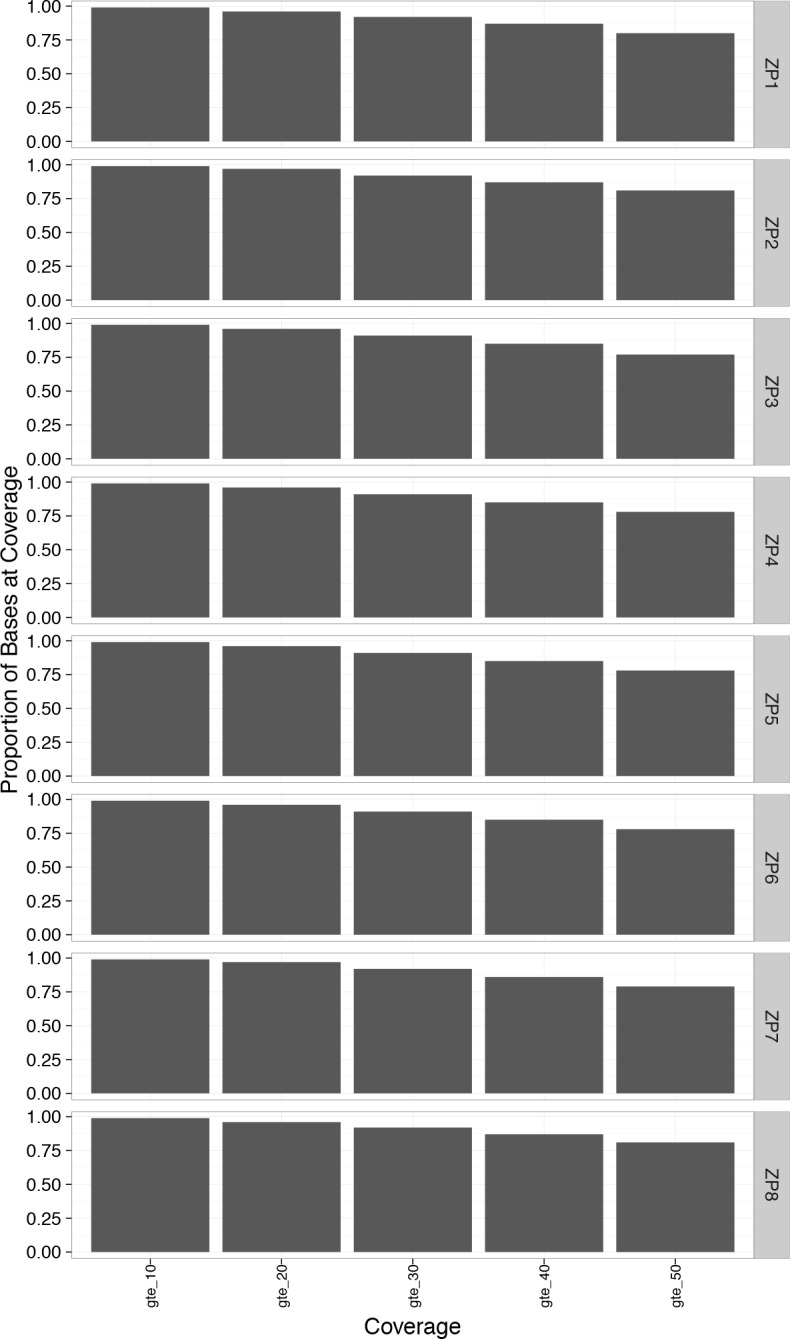
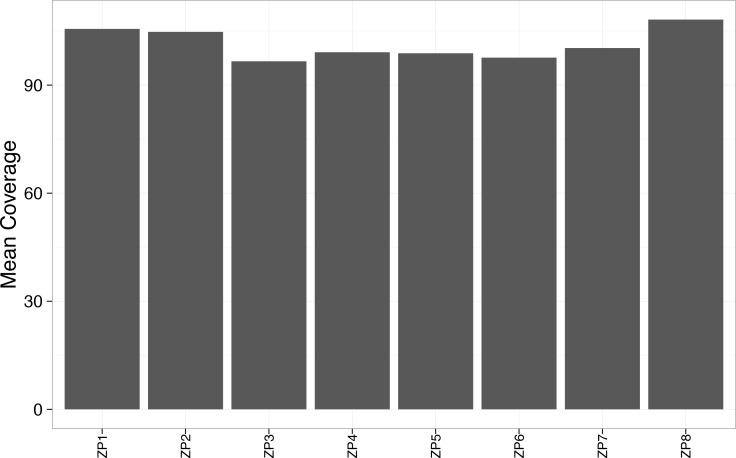
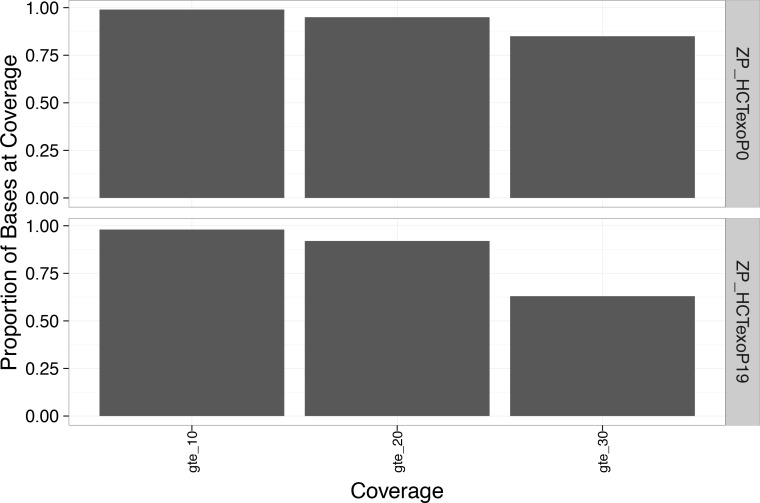
Figure 2—figure supplement 9. Greater than 90% of the bases in the WES genome exceeded 30x coverage.
