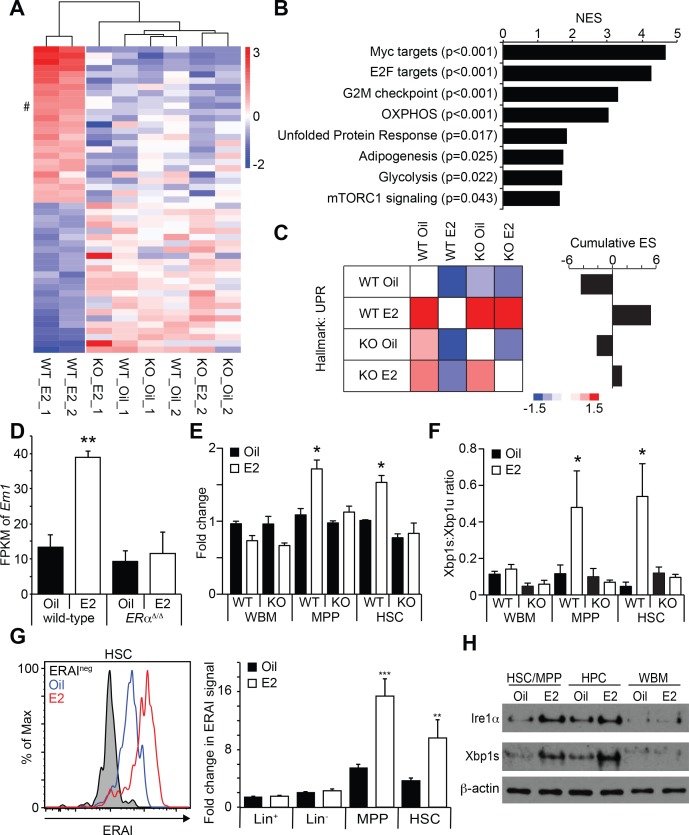
Figure 4. Estrogen Activates the Ire1α-Xbp1 Branch of the UPR.
(A) Unsupervised hierarchical clustering of genes with log2 fold change larger than one identified by RNA-seq. Top 25 genes for each cluster are shown. # indicates Ern1, which encodes Ire1α. (B) GSEA was performed between oil- and E2-treated HSCs. Gene sets significantly enriched in E2-treated HSCs are shown. (C) Pair wise GSEA was performed to test the enrichment of UPR-related genes in wild-type or ERα-deficient HSCs after either oil- or E2-treatment (left). E2-treated wild-type HSCs had enrichment of UPR genes, as indicated by the cumulative enrichment score (right). (D) Fragments per kilobase of exon per million fragments mapped (FPKM) of Ern1 transcript was increased in HSCs upon E2 treatment, and this increase was dependent on ERα. **p<0.01 by two-way ANOVA. (E) Quantitative PCR assays confirmed that the induction of Ire1α in HSCs, as well as in MPPs, upon E2 treatment was dependent on ERα (n = 3, two independent experiments). *p<0.05 by two-way ANOVA. (F) Xbp1 splicing was determined by a two-color Taqman assay. Xbp1 splicing was induced in HSCs and MPPs upon E2 treatment in an ERα-dependent manner. The ratio between spliced (Xbp1s) to unspliced (Xbp1u) Xbp1 transcript is shown (n = 4, two independent experiments). *p<0.05 by two-way ANOVA. (G) Xbp1 splicing was also determined by flow cytometry using the ERAI strain. Grey histogram represents the background signal from ERAI- HSCs. **p<0.01; and ***p<0.001 by Student’s t-test. (H) Immunoblotting was performed using HSC/MPP (CD48-/lowLSK), progenitor cells (CD48+LSK), and WBM cells. Both Ire1α and Xbp1s protein levels were increased by E2 treatment in immature cells. All data represent mean ±standard deviation.


