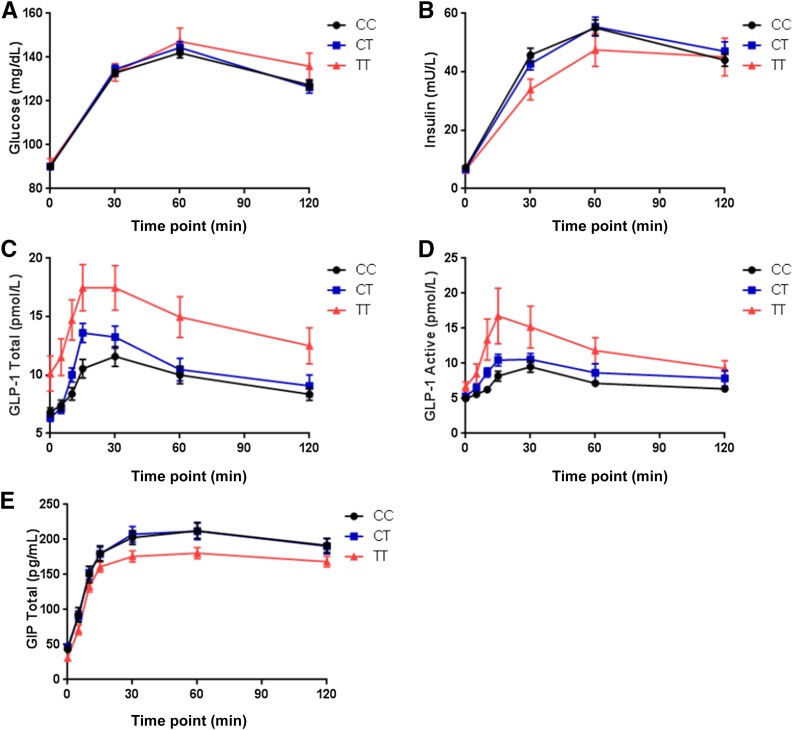
Figure 2.
A and B: n = 608 (CC = 311, CT = 242, TT = 55). A: Change in plasma glucose across the various time points of the OGTT at visit 2 after four doses of metformin. B: Change in plasma insulin across the various time points of the OGTT at visit 2 after four doses of metformin. C–E: n = 150 (CC = 50, CT = 50, TT = 50). C: Change in plasma GLP-1 (total) across the various time points of the OGTT at visit 2 after four doses of metformin. D: Change in plasma GLP-1 (active) across the various time points of the OGTT at visit 2 after four doses of metformin. E: Change in plasma GIP across the various time points of the OGTT at visit 2 after four doses of metformin. Data depict mean ± SEM.

