
Fig. 4. Mouse gene-level mutational landscape of LIHC.
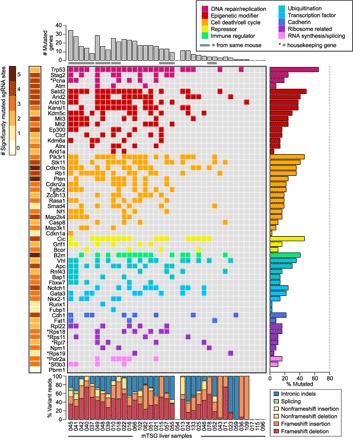
Each row in the figure corresponds to one gene in the mTSG library, whereas each column corresponds to one mTSG-treated liver sample. (Top) Bar plots of the total number of MGs identified in each mTSG-treated liver sample (n = 37). Samples originating from the same mouse are grouped together and denoted with a gray bar underneath. (Middle) Tile chart depicting the mutational landscape of primary liver samples infected with the mTSG library. Genes are grouped and colored according to their functional classifications (DNA repair/replication, epigenetic modifier, cell death/cycle, repressor, immune regulator, ubiquitination, transcription factor, cadherin, ribosome-related, and RNA synthesis/splicing), as noted in the legend in the top-right corner. Colored boxes indicate that the gene was mutated in a given sample, whereas a gray box indicates no significant mutation. Asterisks denote several preselected genes that were generally considered housekeeping genes. (Right) Bar plots of the percentage of liver samples that had a mutation in each of the genes in the mTSG library. Trp53, Setd2, Pik3r1, Cic, B2m, Vhl, Notch1, Cdh1, Rpl22, and Polr2a were the top MGs in each of the 10 functional classifications, respectively. (Bottom) Stacked bar plots describing the type of indels observed in each sample, color-coded according to the legend in the bottom-right corner. Frameshift insertions or deletions comprised the majority of variant reads (median, 59.2% across all samples). (Left) Heat map of the number of mutated sgRNA sites (0 to 5 MSs) for each gene. Multiple mutated sgRNA sites for a given gene are indicative of a strong selective force for loss-of-function mutations in that gene.