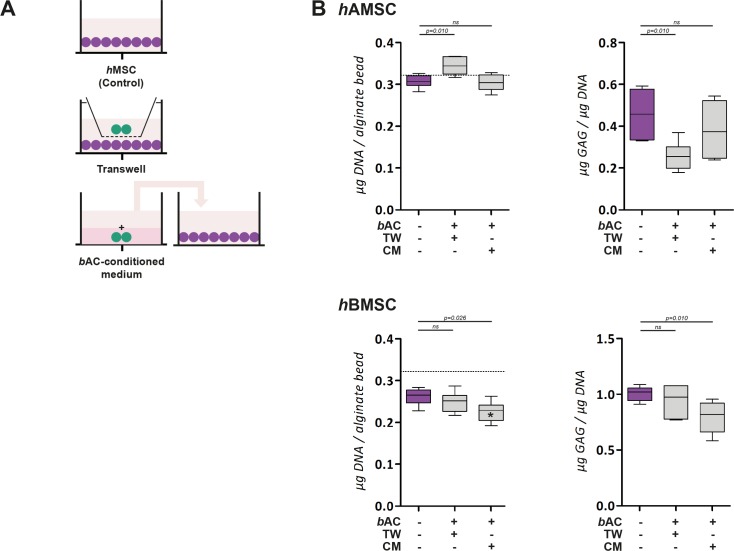
Fig 6. Paracrine effect of bACs on hAMSCs and hBMSCs.
(A) Schematic overview. In purple: hMSCs; in green: bACs. (B) The DNA and GAG content of hAMSCs and hBMSCs in the presence of paracrine factors of bACs via Transwell® system or bAC-conditioned medium. The DNA content after 3 weeks of culture was compared to the initial DNA content prior to cell-culture (dotted line). *, ** or *** indicates p-values smaller than 0.05, 0.01 or 0.001 respectively compared to the amount of DNA prior to cell culture. Data are shown as box-whisker plots of 6 samples of one experiment. For statistical evaluation, a Kruskal-Wallis followed by the Mann-Whitney-U test was use followed by a Bonferroni's post-hoc comparisons test. TW = Transwell; CM = Conditioned Medium; hAMSC = human Adipose-tissue-derived Mesenchymal Stem Cell; hBMSC = human Bone-marrow-derived Mesenchymal Stem Cell; bAC = bovine Articular Chondrocyte.

