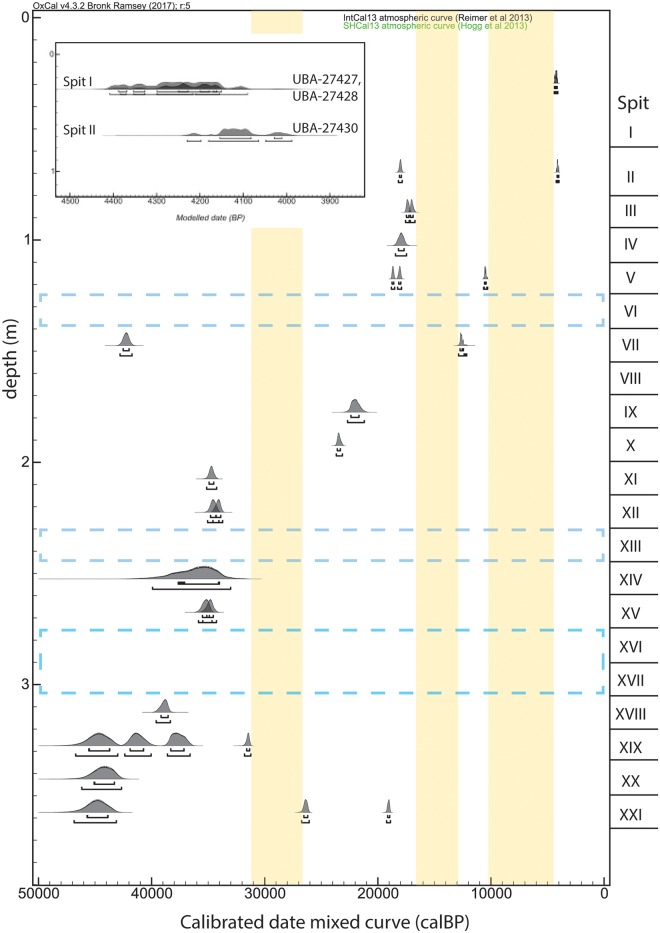
Fig 3. Age-depth relationship of 14C-dated samples.
Calibrated radiocarbon dates are plotted by depth (estimated as midpoint of excavation spit). Blue dashed-line boxes indicate portions of the stratigraphic sequence with no dated specimens. Yellow bars indicate temporal spans with no measured radiocarbon dates. Dates calibrated using OxCal v.4.2 software [65] and a combined IntCal13/SHCal13 calibration curve [66, 67]. The insert shows the youngest dates from Spits I-II.

