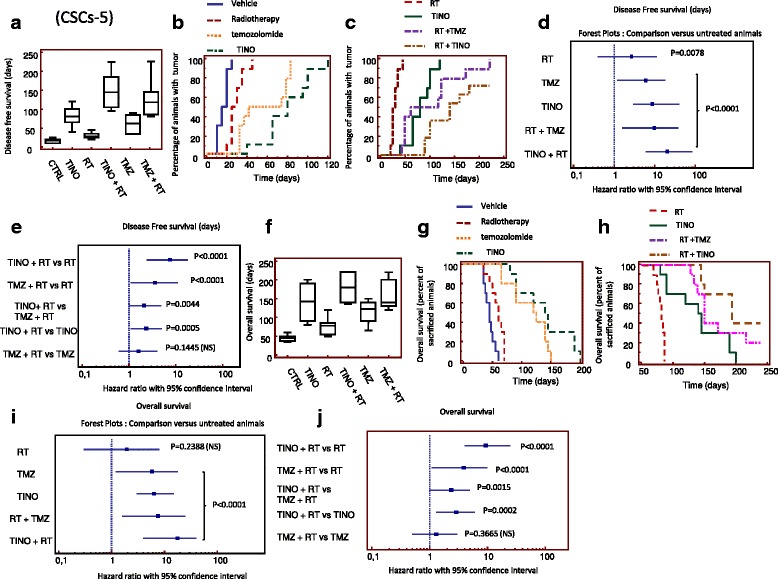
Fig. 9.

Orthotopic intra-brain injection of patient-derived GBM stem-like cells (CSCs-5) and comparison with different treatment groups. a Graphical analyses for the time of Time to detection of bioluminescence or DFS: Median ± CI 95% DFS data (days) for each treatment. b Kaplan-Meier curves generated for tumor detection in animal of control or treated with single treatments (RT, TINO and TMZ). c Kaplan Meyer curves generated for DFS data in animal treated with RT, TINO and their combination. Comparison with standard chemo-radiotherapy consisting in the combination of RT and TMZ. d Forest plots for the comparison of DFS with untreated animals (vehicle treated). e Forest plots for comparison of DFS in combination regimens. f Graphical analyses for the time of overall survival (OS): Median ± CI 95% OS data (days) for each treatment. g Kaplan-Meier curves generated for OS in animal of control (Vehicle), or treated with RT, TINO, and TMZ for the comparison of single treatments. h Kaplan Meyer curves generated for OS in animal treated with RT, TINO, and their combination. Comparison with standard chemo-radiotherapy consisting in the combination of RT and TMZ. i Forest plots for the comparison of OS with untreated animals (vehicle treated). j Forest plots for comparison of OS in combination regimens
