Figure 3.
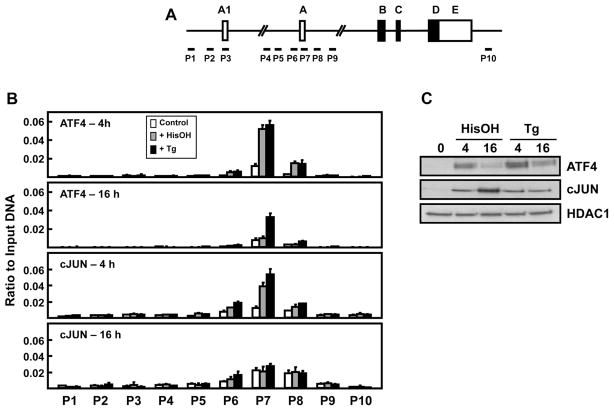
ATF4 and cJUN transcription factor binding across the ATF3 gene locus during activation of the AAR and UPR pathways. (A) Schematic showing ATF3 gene structure and primer locations for ChIP analysis at specific regions of the gene locus. (B) HepG2 cells were cultured in DMEM ± 2.5 mM HisOH or 50 nM Tg for 4 h and 16 h and then the cells were subjected to ChIP analysis with antibodies specific for either ATF4 or cJUN. The data are plotted as the ratio to input DNA values and are means ± S.D. for at least three replicates. (C) Immunoblot analysis of ATF4 and cJUN protein content was performed using nuclear extracts of HepG2 cells incubated in DMEM ± 2.5 mM HisOH or 50 nM Tg for 4 h and 16 h. Each experiment was repeated to ensure reproducibility between batches of cells.

