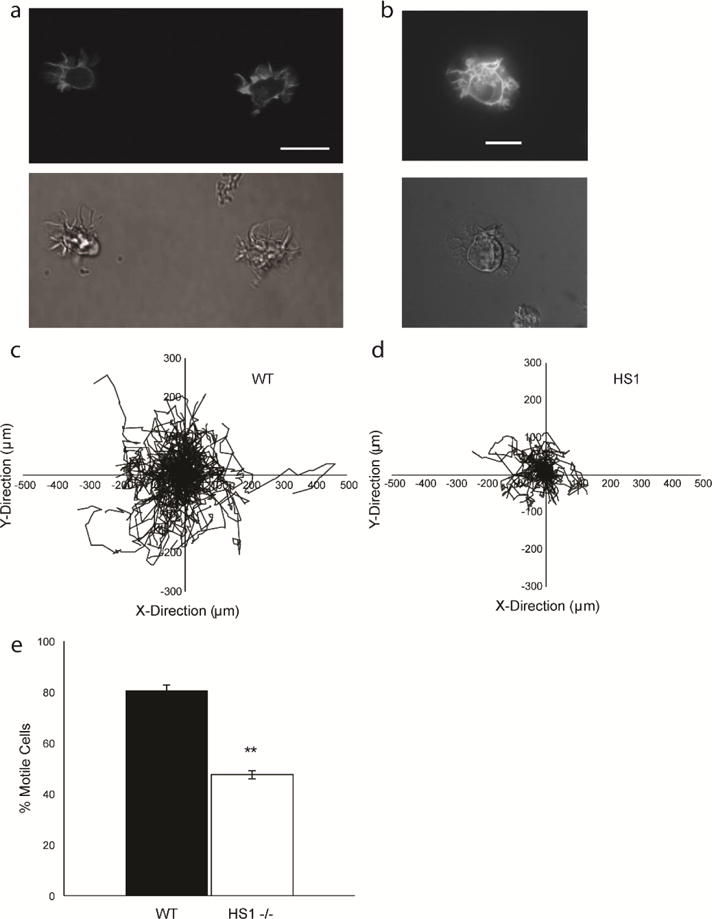
Figure 2.

DCs contain actin rich structures at the leading edge and show defects in migration when HS1 is eliminated. (a) Sample images of GFP-Life-act DCs showing GFP-labeled actin filaments (top) and phase contrast images of the same cells (bottom). Scale bar equals 20 μm. Asterisk denotes broad lamellipodium. (b) Sample images of GFP-Life-act transduced HS1−/− DC showing GFP-labeled actin filaments (top) and bright field images of the same cell (bottom). Cell tracks for (c) WT and (d) HS1−/− DCs during a representative chemokinesis experiment. ≥ 110 cells were tracked per condition for a period of 2–3 hours. (c) Average percentage of motile cells. Figures represent average values ± SEM, for > 1000 DCs from at least three independent experiments per condition. Statistical significance calculated with single factor ANOVA and post hoc Tukey test. Indicates significant difference compared to WT DCs. *p<0.05, **p<0.01
