
Figure 6.
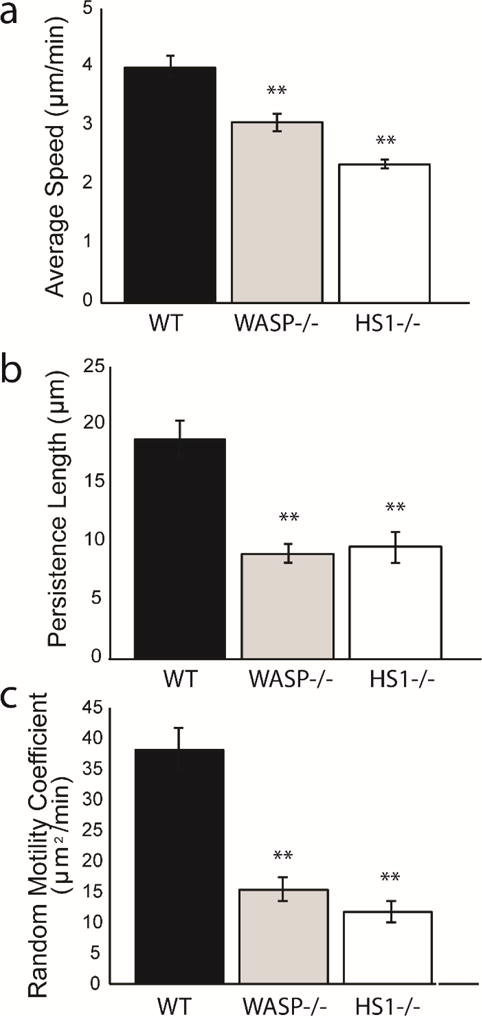
Comparison of chemokinesis of DCs lacking WASP and HS1 (a) average speed, (b) persistence length and (c) random motility coefficient. WASP−/− DCs are shown in gray. WT DCs are shown in blue and HS1−/− DCs are shown in red (values taken from Figure 3 and included for reference). Figures represent average values ± SEM, for > 1000 DCs from at least three independent experiments per condition. Statistical significance calculated with single factor ANOVA and post hoc Tukey test. Indicates significant difference compared to WT DCs. *p<0.05, **p<0.01