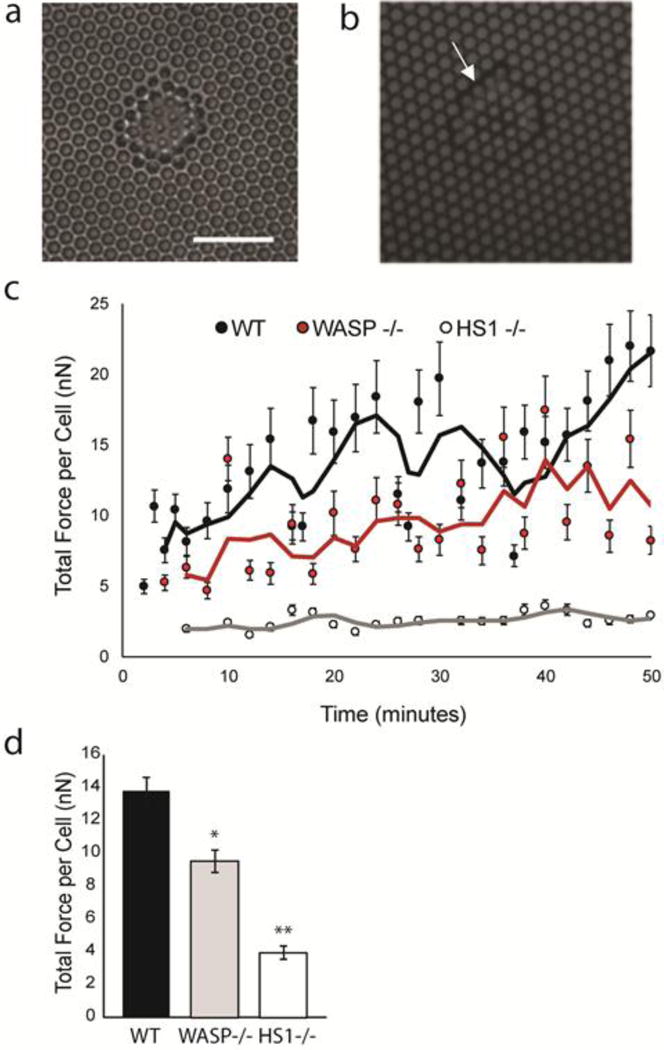
Figure 7.

Calculation of DC traction forces using mPADs. (a) Phase contrast image of DC on mPAD surface. Scale bar equals 20 μm. Fluorescent and phase images correspond to same cell and same position. (b) Sample image of fluorescent micropost tips in area occupied by DC. Post diameter and height are 1.83 μm and 12.9 μm, respectively. (c). Average traction forces for ensemble of WT DCs, HS1−/− DCs and WASP−/− DCs. The forces were calculated from images such as those shown in (a) and (b). Displacement of mPADs was converted to traction force using Hooke’s law and known spring constant (1.92 nN/μm) for the mPAD array. The x-axis indicates time in minutes, with 0 corresponding to the start of imaging. Lines indicate 3 point moving averages for each condition. (d) Time and ensemble averages of DC traction forces, corresponding to values shown in (c). Figures represent average values ± SEM, for at least 28 DCs per condition. Statistical significance calculated with single factor ANOVA and post hoc Tukey test. Indicates significant difference compared to WT DCs. *p<0.05, **p<0.01
