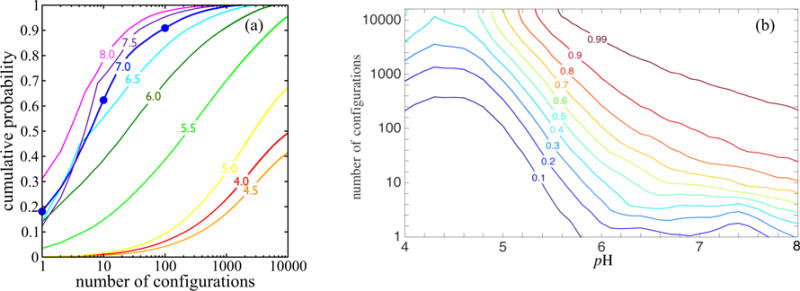
FIG. 13.

(a) Cumulative probabilities of the most probable protonation patterns at a Debye length of 6.0 Å. For example, the dots on the pH 7.0 curve show that under these conditions, the top γB occupancy pattern occurs nearly 20% of the time, one of the first 10 patterns will be present 60% of the time, and one of the top 100 patterns occurs 90% of the time. The pH 4.5 curve shows that one of the first 1000 patterns will be present 20% of the time. (b) Contours of the cumulative probabilities displayed in the [pH,log10(number of configurations)] plane. For example, the 0.99 contour indicates that at pH ≈ 6.8, 1000 configurations account for 99% of the probability.
