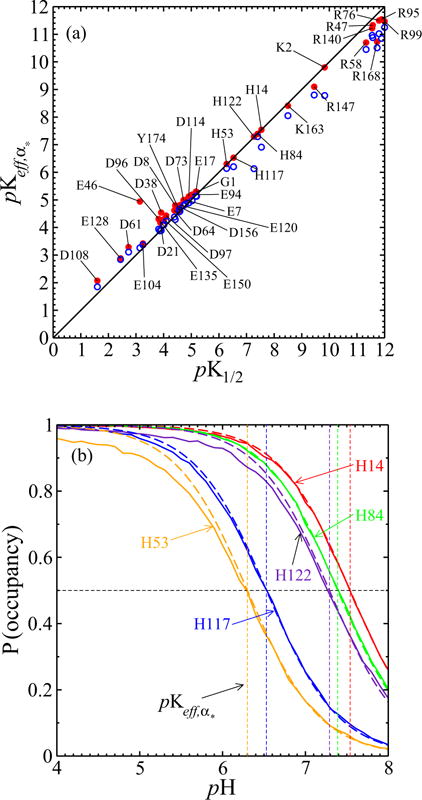
FIG. 15.

(a) The pK1/2 values from simulations of the full model with interactions, on the horizontal axis, are close to the values. Red dots result from taking α* to be the most prominent protonation configuration within 6.6 < pH < 7.3; pK1/2 values farther from 6.6 < pK1/2 < 7.3 differ from those , as expected. Blue open circles result from taking α* to be the most prominent configuration within 4.4 < pH < 4.6; again pK1/2 values farther from that of α* differ more from those of . (b) Except for H53 and H122 below their respective pK1/2, histidine titration curves from the full model (solid line) also agree well with Henderson-Hasselbalch curves (dashed line) as parametrized by the values of the α* used in (a).
