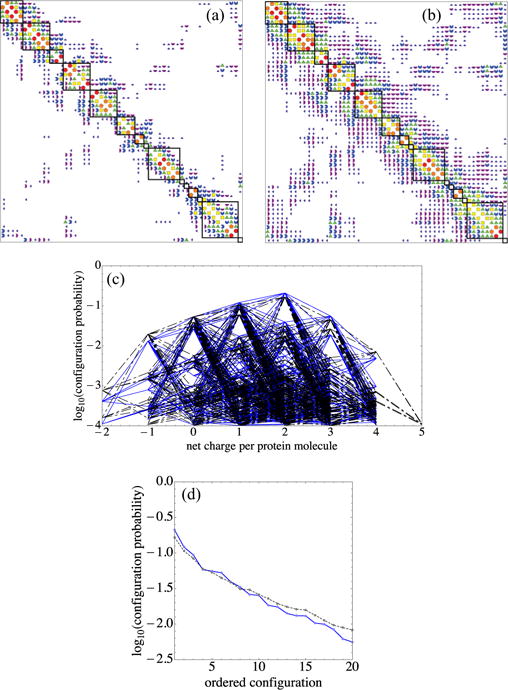
FIG. 16.

Lowering ionic strength, corresponding to increasing the Debye length λD from (a) 6 Å to (b) 20 Å, increases off-diagonal work-of-charging entries and makes the top configurations more prominent while suppressing others, as shown in (c) and (d). In (a) and (b) Wij magnitude codes are as in Fig. 3(a). A 1:1 electrolyte in water at 298 K corresponds to ionic strengths of (a) 257 mM and (b) 23.1 mM. In going from (a) to (b), in all categories but the top (red circles), entries above 0.05kBT increase in number with increased λD. (c) Plot of log10 P vs net charge, as in Fig. 5. Black dash-dotted lines show λD = 6 Å and blue solid lines λD = 20 Å. (d) Plot of log10 P for the top 20 configurations; note the changed vertical scale. The black dashed line shows λD = 6 Å and the blue solid line λD = 20 Å. The contrast between changes in top- and lower-ranked probabilities is shown by the crossing of the dashed and solid curves.
