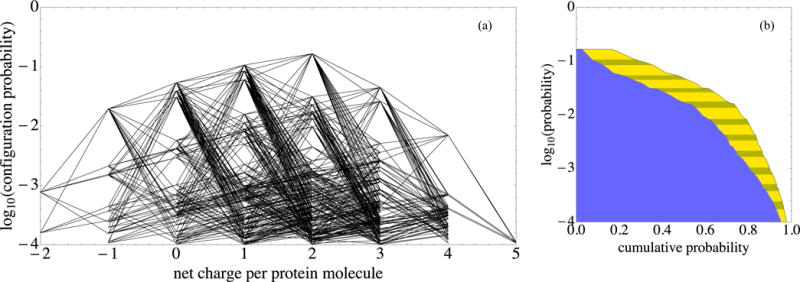
FIG. 5.

Protonation patterns that have opposite net protein charge readily occur at pH 7.1. In both panels, log10 P is plotted vertically for the most prominent pH 7.1 configurations that together account for over 97% of the configuration probability. (a) The net protein charge of each configuration is plotted horizontally. Line segments join configurations that can be transformed into one another with a single-residue protonation switch. (b) (i) The horizontal coordinate of the yellow-striped–clear boundary is the sum of the probabilities of that configuration and more common ones, that is, their cumulative probability. (ii) The horizontal coordinate of the blue–yellow-striped boundary is the square of the same cumulative probability. The blue–yellow-striped boundary estimates the fraction of pairs of neighboring proteins, both molecules of which have one of the configurations down to a given log10 P level; this estimate neglects biasing of pattern probabilities due to protein proximity.
