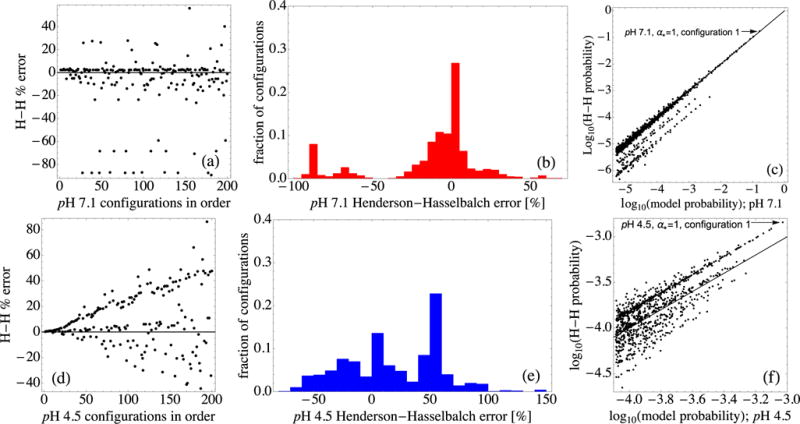
FIG. 9.

(a) Percentage deviation of the Henderson-Hasselbalch probabilities of the top-ranked 200 configurations from those of the full model at pH 7.1. Panels (a)–(c) all use α* = 1 for pH 7.1 to determine values for use in calculating Henderson-Hasselbalch probabilities. (b) Histogram of the same deviations, for the top-ranked 1000 configurations at pH 7.1. (c) A log-log comparison of the top-ranked 1000 configuration probabilities from the full model with the Henderson-Hasselbalch probabilities. Note the clustering along diagonal lines. (d) Similar percentage deviations of the top-ranked 200 configurations at pH 4.5. Panels (d)–(f) all use α* = 1 for pH 4.5 to determine values for use in calculating Henderson-Hasselbalch probabilities. (e) Histogram of the deviations at pH 4.5. (f) A log-log comparison of the top-ranked 1000 configuration probabilities; note the changed scales.
