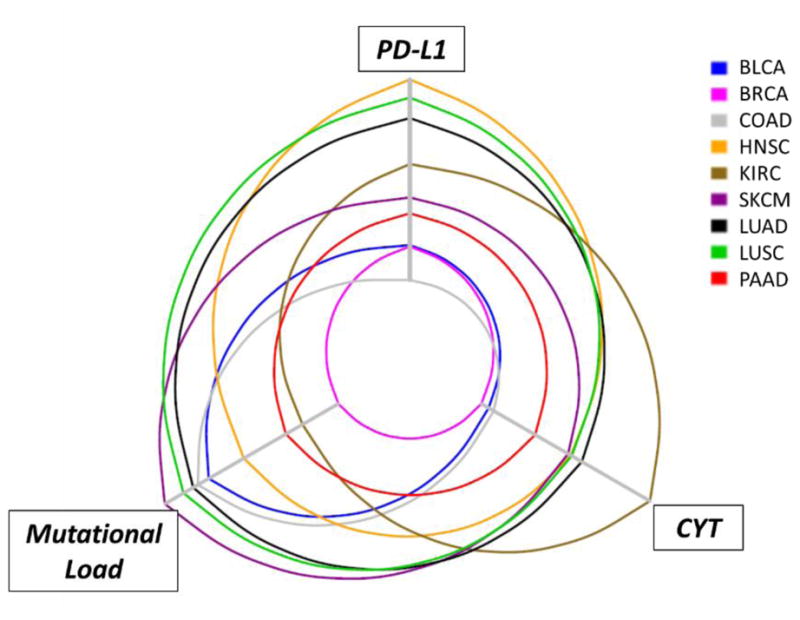
Figure 2. Hive plot for demonstrating the relationship between PD-L1 expression, CYT (cytotoxic gene signature expression), and mutational load in multiple common solid tumor types.

Comparisons of PD-L1 and CYT expression levels amongst different tumor types have been challenging due to the diverse assays used across studies. TCGA public datasets were used to determine the relative expression levels of PD-L1 and CYT (combined GZMA_PRF1 transcript levels, indicating cytolytic effector activity56). for nine solid tumor types (SKCM, melanoma; KIRC, renal cell carcinoma; LUSC, squamous cell carcinoma of the lung; LUAD, lung adenocarcinoma; COAD, colonic adenocarcinoma; HNSC, head and neck squamous cell carcinoma; PAAD, pancreatic adenocarcinoma; BRCA, breast carcinoma; BLCA, bladder carcinoma). Each axis increases in value as it extends from the center of the plot. The highest levels of median PD-L1 expression are seen in the tumor types with squamous differentiation, consistent with the known constitutive expression in these tumor types. Notably, PD-L1 expression levels and CYT track each other closely, while mutational density tends to be less aligned.
