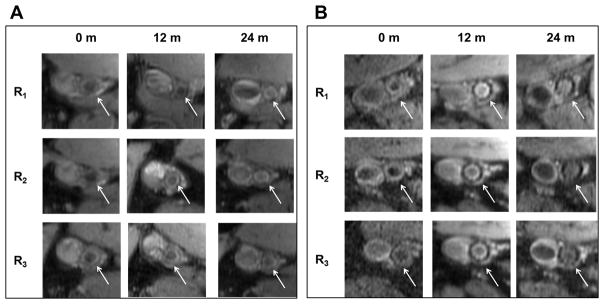
Figure 3.
(case-4, 5 and 6) show the plot of time-averaged wall shear stress (TAWSS in Pa) and oscillatory shear index (OSI, dimensionless) over a full cardiac cycle, respectively in a superficial femoral artery (SFA). Letters A and P represent the anterior and posterior view of the artery with co-registered regions at baseline (case-4: pre-intervention) and post-intervention 12 & 24-months (case-5 and 6 respectively). Color bars in the right panel represent a range of TAWSS and OSI values, respectively.

