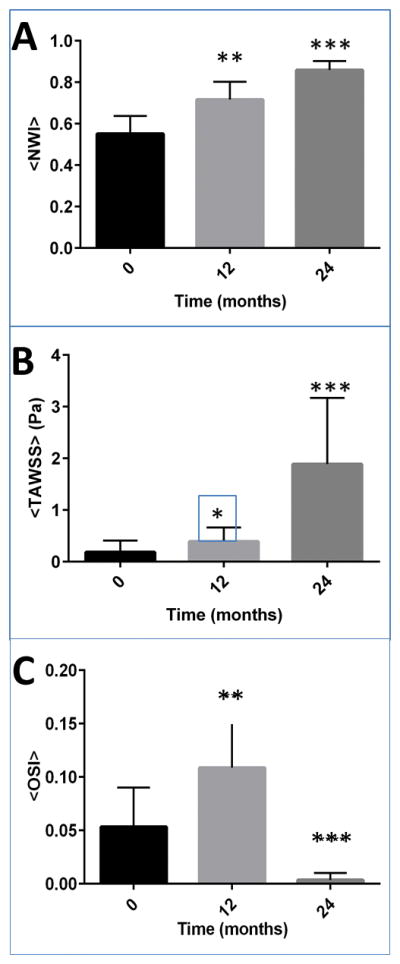
Figure 7.

Shows the plot of (A) the plot of average normalized wall index (NWI), (B) the spatial average of TAWSS [Pa]; (C) the spatial average of OSI for all six cases specifically at the region of interest R1, R2, and R3. Shown error bars are standard error, and ** indicates significance from baseline (P-value < 0.01) and *** indicates significance from baseline (P-value < 0.001). For this plot, a sample size of MRI slices was 90. Non-parametric Kruskal-Wallis test and Dunn’s multiple comparison tests were performed to assess significance.
