
Fig. 2. Pgc promotes cystoblast differentiation.
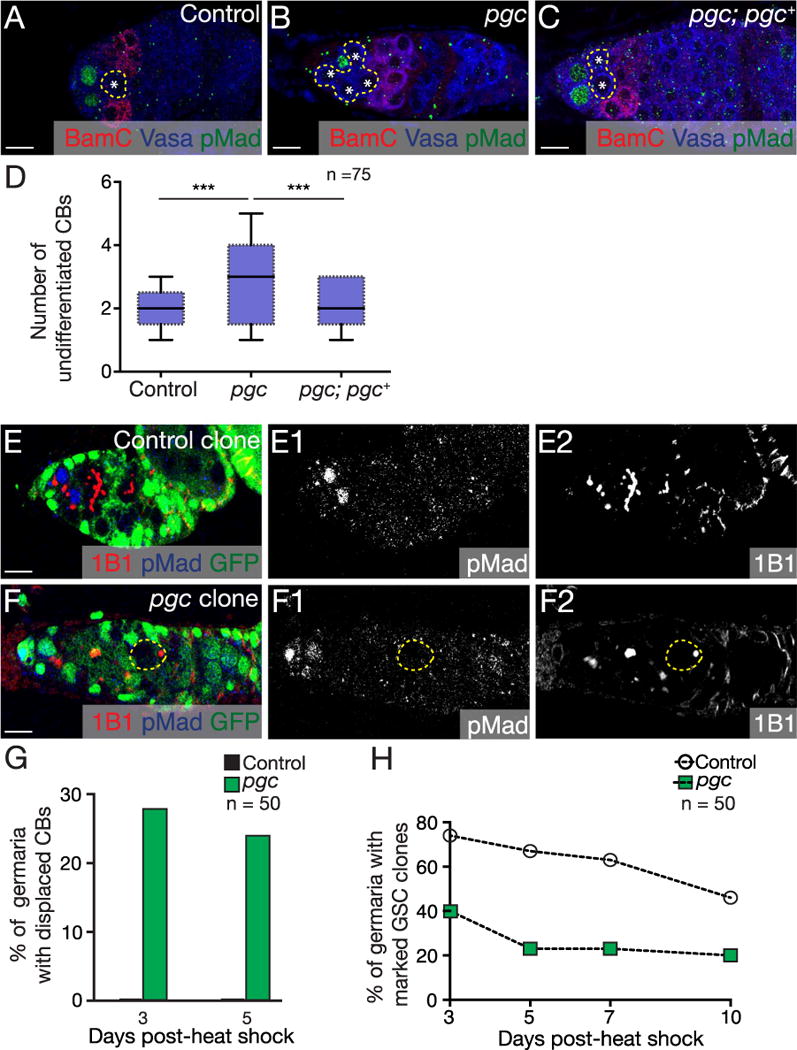
(A–C) Germaria of a control, pgc mutant and pgc; pgc+ ovaries stained with BamC (red), Vasa (blue) and pMad (green). pgc mutants accumulate supernumerary undifferentiated cells. This phenotype is rescued by providing two copies of genomic pgc+ transgene. (D) Quantification of number of undifferentiated CBs in the germaria of WT, pgc mutants and pgc; pgc+ (2.4 ± 0.7 in control, 4.4 ± 1.1 in pgc and 2.7 ± 0.7 in pgc; pgc+, n=75 germaria). Horizontal lines in a box-and-whisker plots represent maximum, third-quartile, median, first quartile and minimum. Paired t-test was performed. *** p < 0.0001. Germaria of (E) control clone and (F) pgc clones stained with 1B1 (red), pMad (blue) and GFP (green). When compared to the control clone 3 days post heat shock, pgc clone germaria show a pMad negative, single undifferentiated cell displaced far away from the niche. pMad and 1B1 channels are shown in E1, F1 and E2, F2 respectively. (G) Quantification of the percentages of single undifferentiated cells found away from the niche 3 and 5 days post heat shock (n=50). (H) Graphical representation of percentage of marked GSC clones present after 3, 5, 7 and 10 days post heat shock (n=50). For representative images see Fig. S3F–K. Scale: 10 µm. (For interpretation of the references to color in this figure legend, the reader is referred to the web version of this article.)