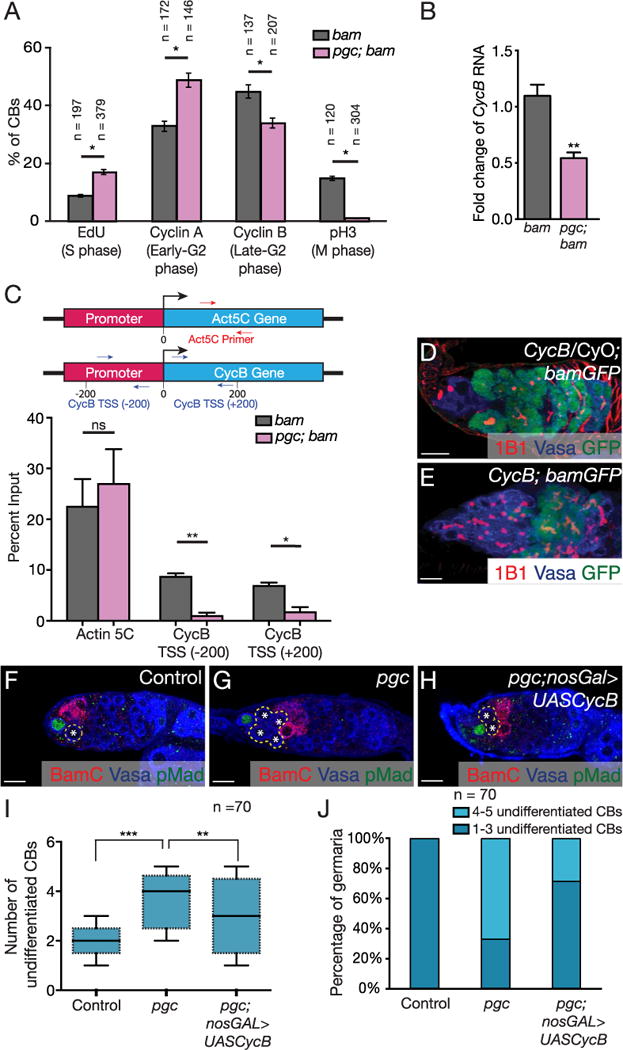
Fig. 3. Pgc promotes cell cycle progression.

(A) Quantification of CBs positive for different cell cycle markers in both bam and pgc; bam mutants. An increase in S phase cells in pgc; bam mutants was observed (9% in bam, n=197 cells and 17% in pgc; bam, n=379 cells, p < 0.05). pgc; bam mutants had a higher number of cells positive for early-G2 phase marker, CycA (33% in bam, n=172 cells and 49% in pgc; bam, n=146 cells, p < 0.05). pgc; bam mutants also showed fewer cells positive for the late-G2 phase marker, CycB (45% in bam, n=137 cells and 34% in pgc; bam, n=207 cells, p < 0.05), and even lower M phase positive cells (15% in bam, n=120 cells and 1% in pgc; bam, n=304 cells, p < 0.05). For representative images see Fig. S4A–H. Two-way ANOVA test was performed. * p < 0.05. (B) qPCR analysis shows CycB mRNA is down regulated in pgc; bam tumors when compared to bam tumors. Paired t-test was performed. **p < 0.001. (C) qPCR analysis on positive control Act5c intron1 fragment and CycB transcription start site (−200) and (+200) after Pol II ChIP experiments in bam and pgc; bam mutants. CycB transcription in pgc; bam mutant shows a decrease as compared to bam mutant, whereas transcription of Act5c does not change. (D) Germarium of CycB/ CyO; bamGFP flies stained with 1B1 (red), Vasa (blue) and GFP (green) show timely expression of Bam. (E) Germarium of CycB; bamGFP flies stained with 1B1 (red), Vasa (blue) and GFP (green) show a significant accumulation of undifferentiated cells with delayed Bam expression. (F–H) Germaria of a control, pgc mutant and pgc; nosGal4 > UASCycB ovaries stained with BamC (red), Vasa (blue) and pMad (green). pgc mutants accumulate undifferentiated cells which is partially rescued by overexpressing CycB in the germ line. (I) Quantification of number of undifferentiated CBs in the germaria of WT, pgc mutants and pgc; nosGal4 > UASCycB (2.1 ± 0.5 in control, 3.9 ± 1.0 in pgc and 3.0 ± 0.9 in pgc; UASCycB n=70 germaria). Horizontal lines in a box-and-whisker plots represent maximum, third-quartile, median, first quartile and minimum. Paired t-test was performed. *** p < 0.0001, ** p < 0.001 (J) Stacked graph representing the distribution of pre-CB numbers observed in WT, pgc mutant and pgc; nosGal4 > UASCycB germaria. Scale: 10 µm. (For interpretation of the references to color in this figure legend, the reader is referred to the web version of this article.)
