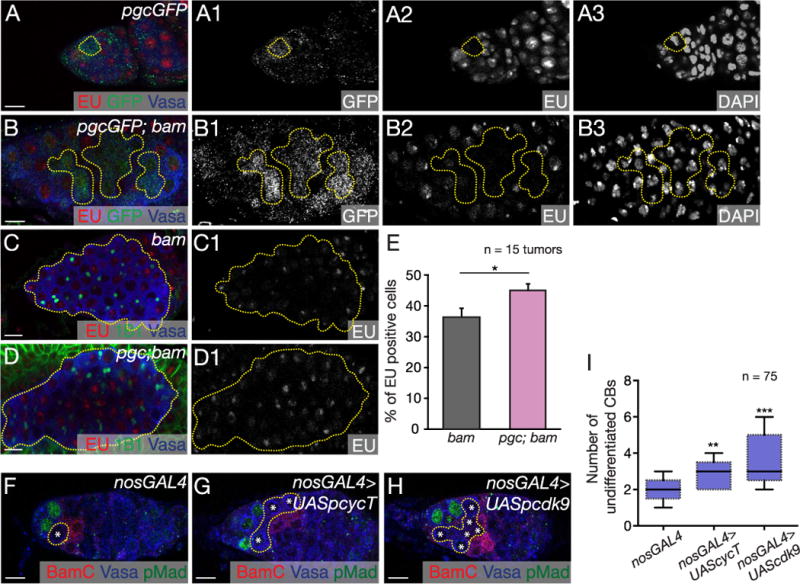
Fig. 4. Pgc causes transcriptional silencing in the stem cell daughter via the P-TEFb complex.

(A–A3) pgcGFP germarium pulsed with EU (red) and stained with GFP (green) and Vasa (blue) showed no transcription in Pgc expressing cell (yellow circle). GFP, EU and DAPI channels are shown in A1–A3 respectively. (B–B3) pgcGFP; bam tumors pulsed with EU (red) and stained for GFP (green) and Vasa (blue) show 64% of Pgc expressing CBs are transcriptionally quiescent (n=20 tumors). GFP, EU and DAPI channels are shown in B1–B3 respectively. (C–D1) bam and pgc; bam tumors pulsed with EU (red) and stained with 1B1 (green) and Vasa (blue). EU channels are shown in C1 and D1 respectively. (E) Quantification of cells positive for EU in bam and pgc; bam tumors. pgc; bam mutants had 45% of cells positive for EU incorporation compared to 36% of cells in bam mutant (n=15 tumors). Error bars are represented by standard error. Paired t-test was performed. * p < 0.05. Germaria of (F) nosGal4, (G) nosGal4 > UASp cyclinT and (H) nosGal4 > UASp cdk9 flies stained with pMad (green), Vasa (blue) and BamC (red). (I) Quantification of undifferentiated CBs in nosGal4 (1.9 ± 0.6), nosGal4 > UASp cyclinT (2.9 ± 0.7) and nosGal4 > UASp cdk9 (3.4 ± 1) germaria. nosGal4 > UASp cyclinT and nosGal4 > UASp cdk9 germaria showed accumulation of undifferentiated cells when compared to nosGal4 control (n=75 germaria). Horizontal lines in a box-and-whisker plots represent maximum, third-quartile, median, first quartile and minimum. Paired t-test was performed. ** p < 0.001, ***p < 0.0001. Scale: 10 µm. (For interpretation of the references to color in this figure legend, the reader is referred to the web version of this article.)
