
Fig. 5. Mapping of HBV S transcripts from an HBeAg positive and an HBeAg negative chimpanzee.
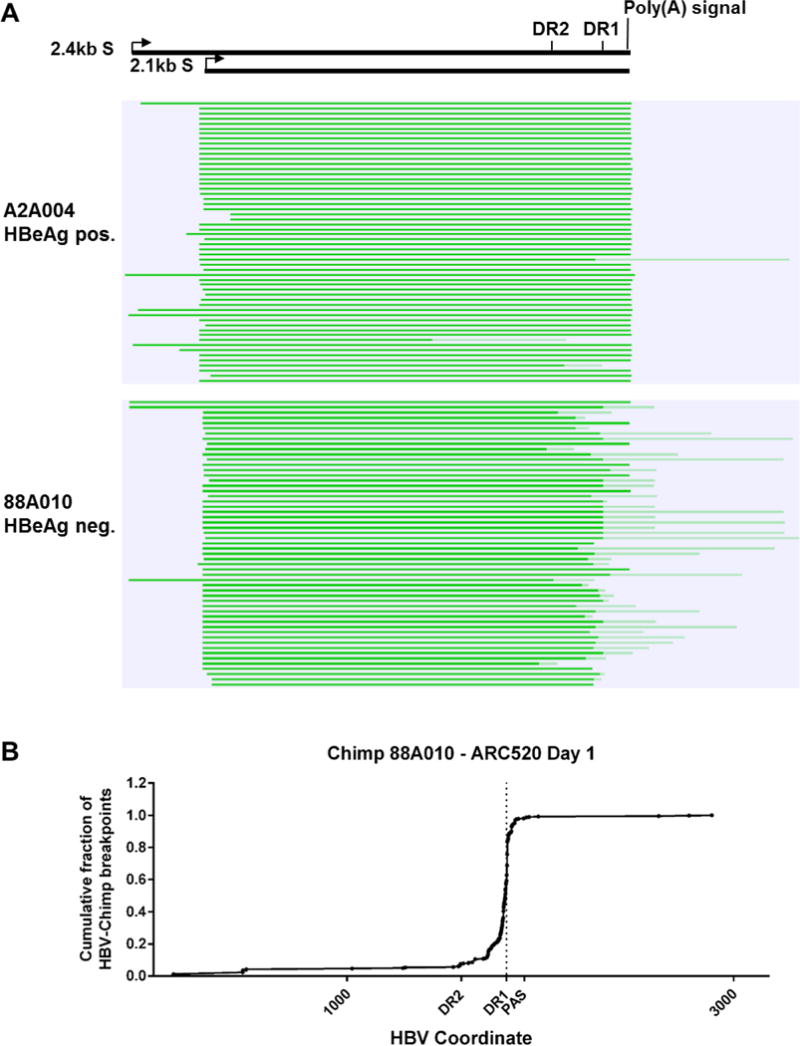
Total RNA isolated from the liver biopsies after the NUC lead-in and before ARC-520 dosing on Day 1 from HBeAg positive chimpanzee A2A004 and HBeAg negative chimpanzee 88A010 was reverse transcribed, size-selected and sequenced with single molecule real-time (SMRT) sequencing. (A) Full-length nonconcatemer reads (see methods) were aligned to each chimpanzee’s consensus HBV DNA sequence with CLC Genomics Workbench. Precore/pgRNA transcripts are not shown in this view. These were detected in A2A004 but were not in 88A010 at this sequencing depth. Green lines represent HBV-containing transcripts. Dark green represents sequences aligning to HBV and light green represents those not aligning to HBV. The HBV coordinates are shown with elements DR2, DR1 and the HBV polyadenylation signal. (B) Cumulative fraction of HBV-chimpanzee breakpoints were plotted against the HBV coordinate.