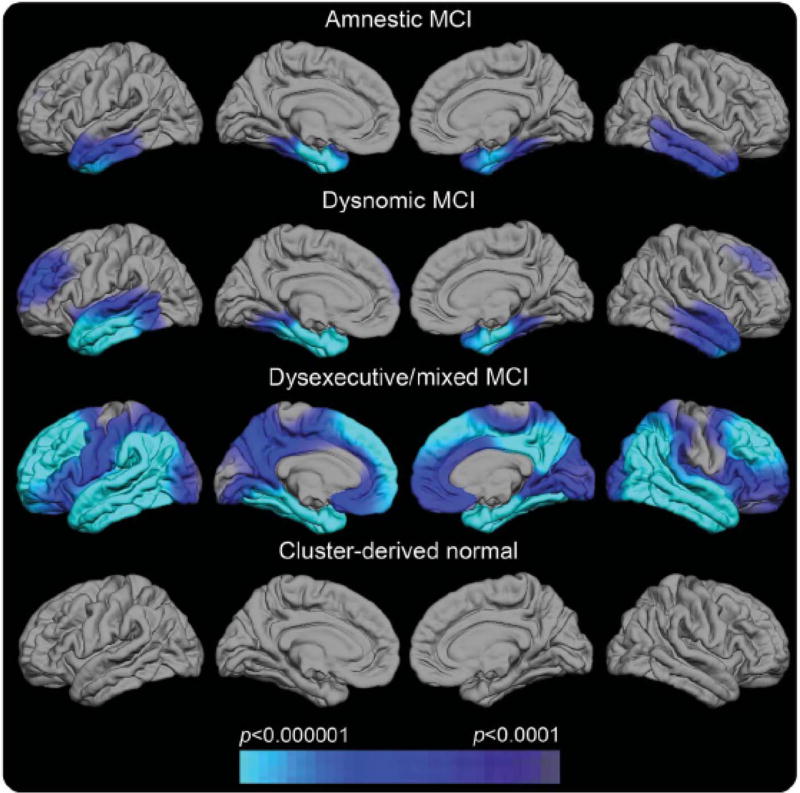
Fig. 7.
Regional cortical thickness maps of the left and right lateral and medial pial surfaces for each neuropsychological MCI subtype relative to normal control (NC) participants (Edmonds et al., 2016). The scale indicates group differences in cortical thickness at p< .0001. The cyan/blue shades represent areas where the MCI subgroup has significantly thinner cortex than the NC group. Cluster-derived normal (CDN) = those participants who performed normally across the neuropsychological tests but whom ADNI diagnosed as MCI. Their maps show no areas of cortical thinning relative to the NC group, suggesting they are false-positive diagnostic errors. Our prior work showing the CDN subgroup to have normal CSF AD biomarkers and low progression rates adds to the inference that they received false-positive MCI diagnoses (Bondi et al., 2014).

