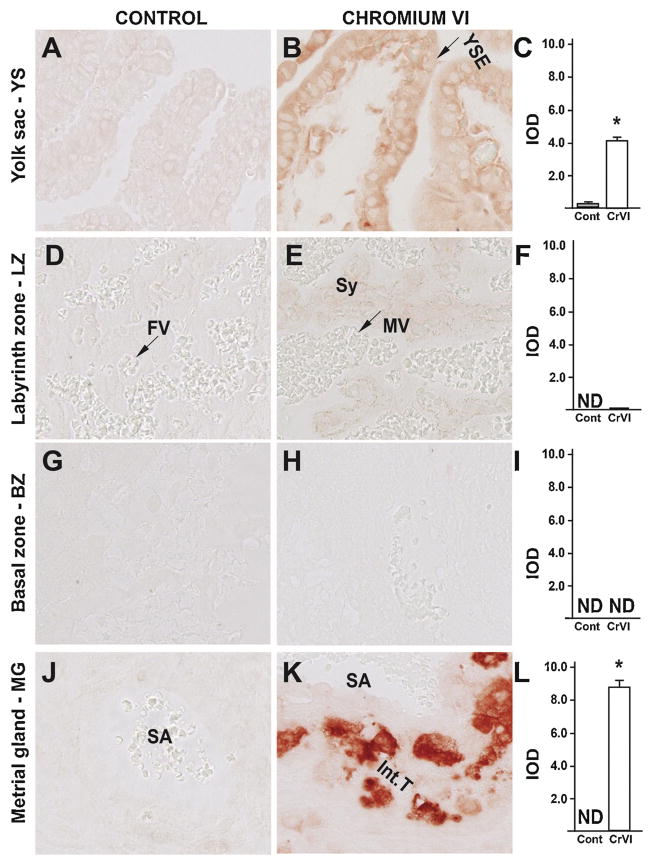
Fig. 5.
Effect of CrVI on the expression of casp-3 protein in placenta on gestation day 18.5. Pregnant mothers (n = 5) received drinking water with or without CrVI (50 ppm) from gestational day (GD) 9.5 – 14.5. Placentas were separated on GD 18.5 and processed for IHC as given in materials and methods. Images were captured from the YS (A – control; B – CrVI), labyrinth zone (D – control; E – CrVI), basal zone (G – control; H – CrVI), and MG (J – control; K – CrVI) at 400 x magnification. Histograms showing integrated optical density (IOD) are given for the respective regions of the placenta (YS – C, LZ – F, BZ – I and MG – L). YSE – YS epithelium, MV – maternal vessel, FV –fetal vessel, Cy – cytotrophoblast, Sy – syncytiotrophoblast, TG – trophoblastic giant cell, GC – glycogen cell, Sp – spongiotrophoblast, mDC – mesometrial decidual cells, SA – spiral artery, En – vascular endothelial cells, Int.T – interstitial trophoblast. YS – YS, LZ – labyrinth zone, BZ – basal zone and MG – MG. Arrows point to individual cell types. Each value represents mean ± SEM of 5 placentas. *Control vs CrVI, P < 0.05. Width of field for each image is 220 μm.

