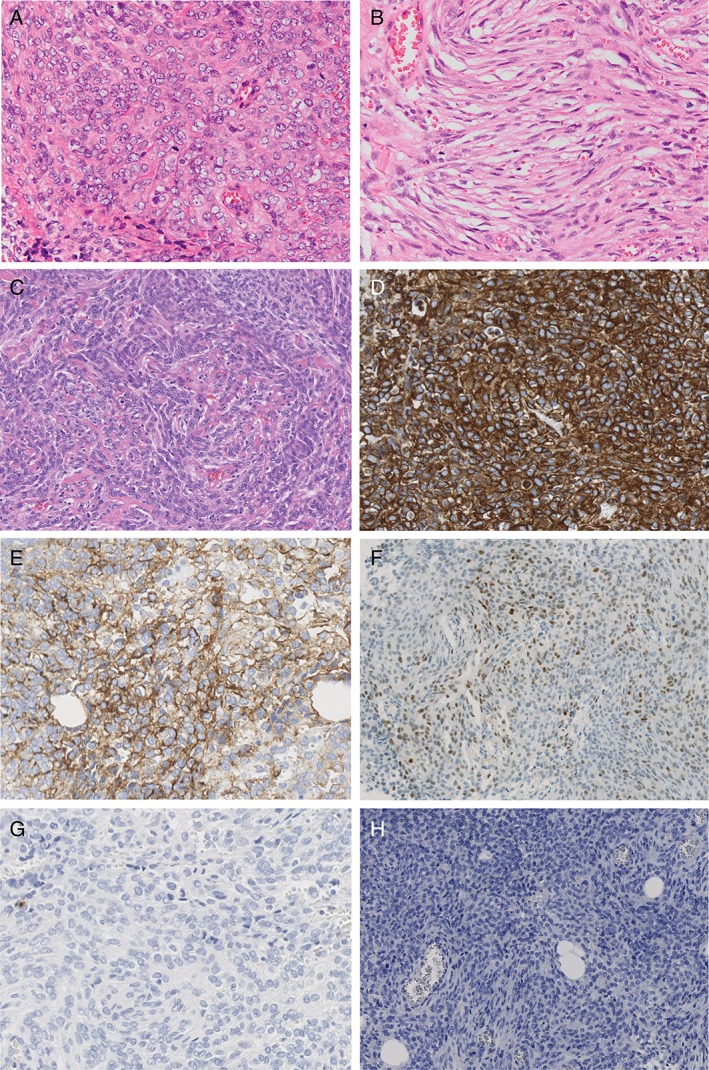
Figure 2.

(A) Pleural samples showing an accumulation of abundant atypical epithelioid cells (H‐E* stain). (B) Pleural samples showing a large number of fusiform cells (H‐E stain). (C) Brain biopsy tissue showing a similar pattern (H‐E stain). (D) Atypical pleural cells positive for vimentin. (E) Atypical pleural cells positive for EMA. (F) Atypical pleural cells positive for progesterone receptor. (G) Atypical pleural cells negative for calretinin. (H) Atypical pleural cells negative for keratin CAM 5.2. H‐E, haematoxylin–eosin; EMA, epithelial membrane antigen. All slides were taken at 200 times magnification.
