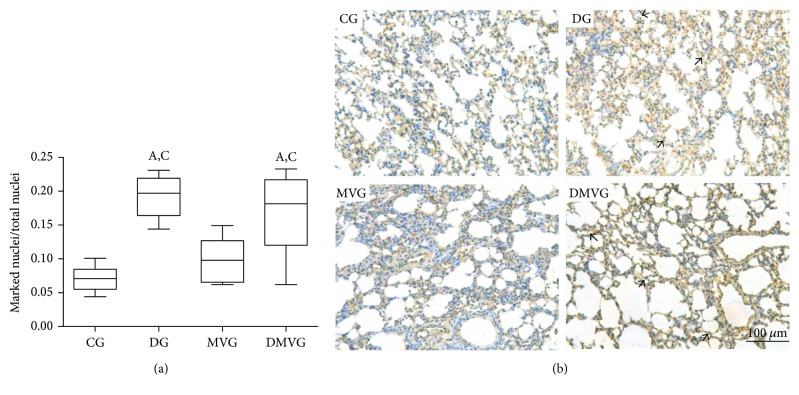
Figure 2.
Immunohistochemistry for HMGB1. (a) Ratio between the number of nuclei labeled for HMGB1 antibody and the total number of nuclei. Data are expressed as mean ± standard error of the mean (n = 10). (A) and (C) represent a significant difference in relation to CG and MVG (p < 0.05) using Kruskal-Wallis analysis followed by Dunn's posttest. (b) Histological section of lung parenchyma stained by immunohistochemical technique. Bar = 100 μm. The arrows point to marked nuclei.

