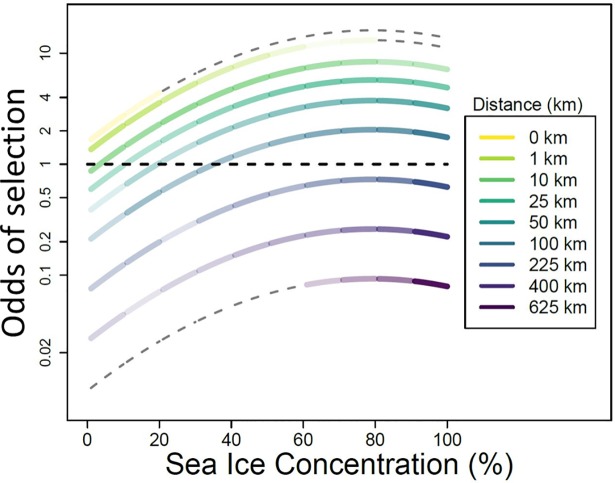
Fig 5. Graphical representation of model results for habitat within the sea-ice field (i.e., sea_ice = yes).
Values for odds of selection > 1 indicate chosen habitat and values < 1 indicate rejected habitat. Individual curves represent the interactive effects of various distances to the ice edge (i.e., d2ice) and sea-ice concentration. The shading of each curve represents the relative availability of the given habitat to the tagged seal as sampled by the simulation. Gray dashes indicate no tagged seals occupied that habitat. In general, young bearded seals chose to be close to the edge and in higher ice concentrations, but the combination of these conditions are quite rare. For all distances, habitat selection peaked at about 80% ice concentration.

