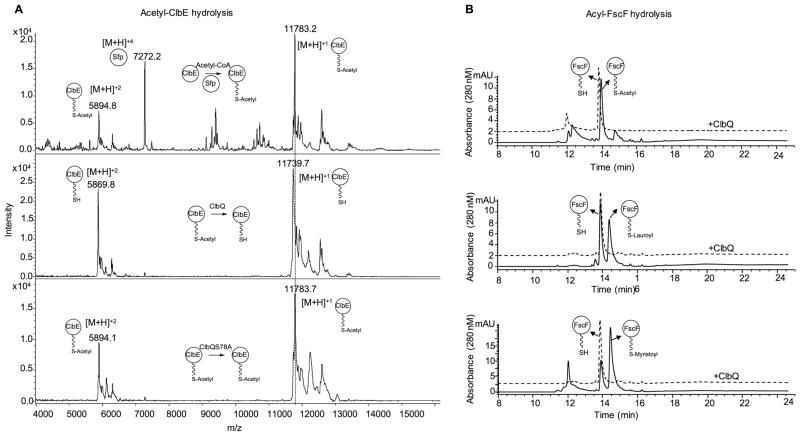
Figure 5.
Acyl-ACP hydrolysis by ClbQ. (A) MALDI (matrix-assisted laser desorption/ionization) analysis of acetyl-ClbE hydrolysis by ClbQ. Mass spectrum of acetyl-ClbE (top panel), reaction with WT ClbQ (middle panel), and the ClbQ S78A mutant (bottom). The reference m/z peak at 11783.7 is shown as vertical dotted line. (B) LC-MS analysis of hydrolysis of acetyl-FscF (top), lauroyl-FscF (middle), and myristoyl-FscF (bottom) incubated with ClbQ at 37 °C for 15 min. Acylation reactions of FscF are shown as solid lines, and the hydrolysis reactions of acyl-FscF catalyzed by ClbQ are represented as dotted lines in all three spectra.

