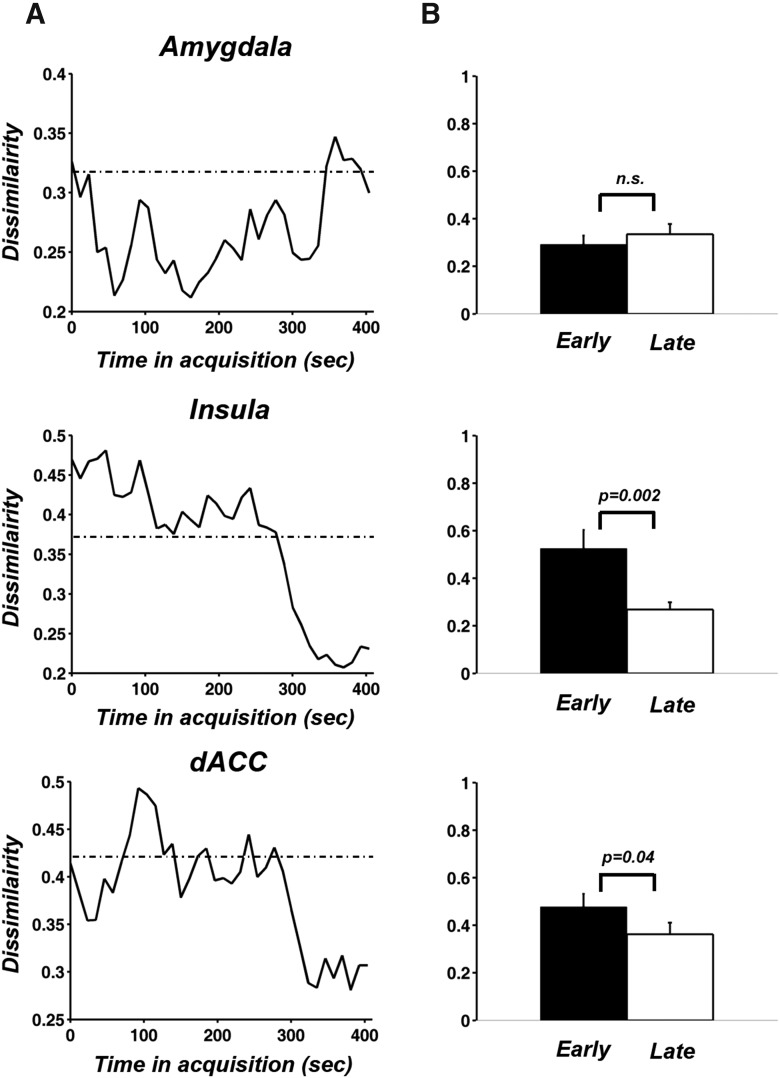
Figure 6.
Time course analysis of multivoxel patterns evoked by CS+ and CS–. A, The time courses of RSA dissimilarity between CS+ and CS– for the three ROIs. The dashed line in each plot indicated the averaged RSA dissimilarity value of that ROI in habituation. B, A paired t test was performed to compare mean dissimilarity of the first 10 points and the last 10 points of the RSA dissimilarity curves in A.

