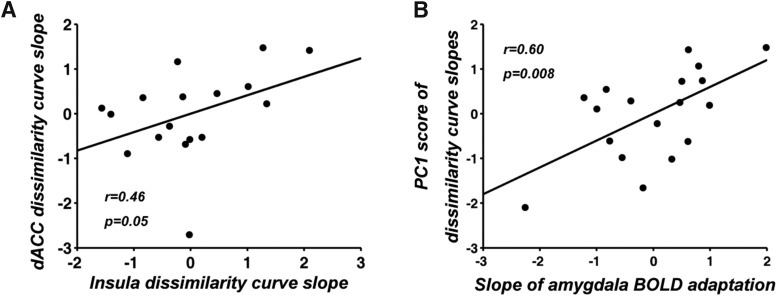
Figure 7.
Analysis of pattern adaptation slopes. A, Slopes of RSA dissimilarity curves from insula and dACC were positively correlated. B, The first principal component explained 73% of the variance of the dissimilarity slope data and its score was positively correlated with the rate of amygdala adaptation.

