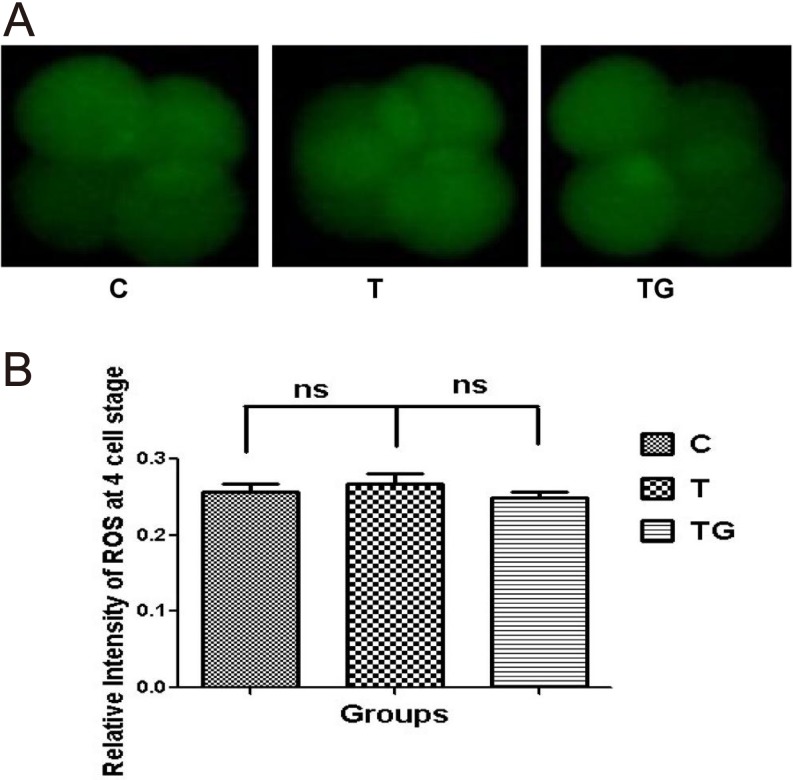
Fig. 1.
Evaluation of ROS content in embryos at 4-cell stage in different culture media (control = C, tunicamycin = T, and tunicamycin + GSH = TG) by staining with DCFH-DA. (A) Fluorescence microscopy of embryos cultured in different media. (B) Quantification of ROS levels in the indicated groups. Fluorescence intensity analysis demonstrates no significant difference in ROS level at the 4-cell stage between the different groups. Images are presented at 400 × magnification. Data are expressed as mean ± standard error of the mean (SEM) of three independent experiments. Asterisks represent statistically significant differences (P < 0.05).

