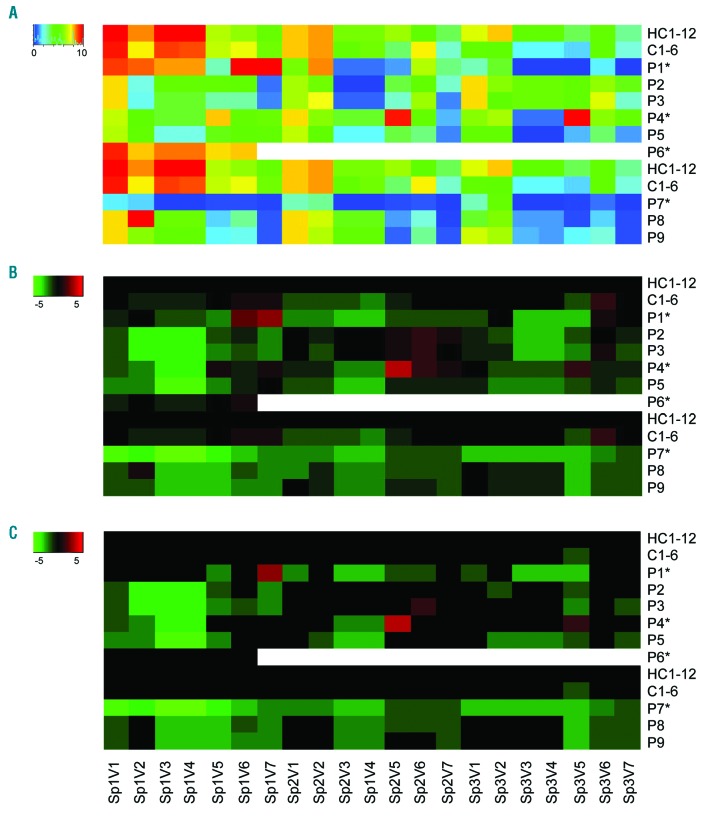
Figure 5.
Integrated analysis of thrombus formation for patients with ORAI1, STIM1 or FERMT3 mutations. Thrombus formation on three microspots was measured with blood from home controls (HC1-12), travel controls (C1-6) and indicated patients/relatives with a genetic mutation in ORAI1 (P1-5), STIM1 (P6) or FERMT3 (P7-9), at wall-shear rate of 1600 s−1, as for Figure 4. Coding of microspots: Sp1, collagen type I; Sp2, von Willebrand Factor (VWF)/rhodocytin; Sp3, VWF/fibrinogen. Coding of outcome parameters: V1, thrombus morphological score (scale 0-5); V2, platelet surface area coverage (% SAC); V3, thrombus contraction score (scale 0-3); V4, thrombus multilayer score (scale 0-3); V5, phosphatidylserine (PS) exposure (% SAC); V6, P-selectin expression (% SAC); V7, αIIbβ3 activation (% SAC). Data were scaled per parameter from 0-10. (A) Heatmap of scaled values for control groups HC1-12 and C1-6 (means); and of scaled values for individual patients (*) and relatives. (B) Subtraction heatmap of scaled values, compared to those from HC1-12. (C) Subtraction heatmap after filtering for differences considered to be relevant, i.e. outside the range of mean ± 2 SD (HC1-12).

