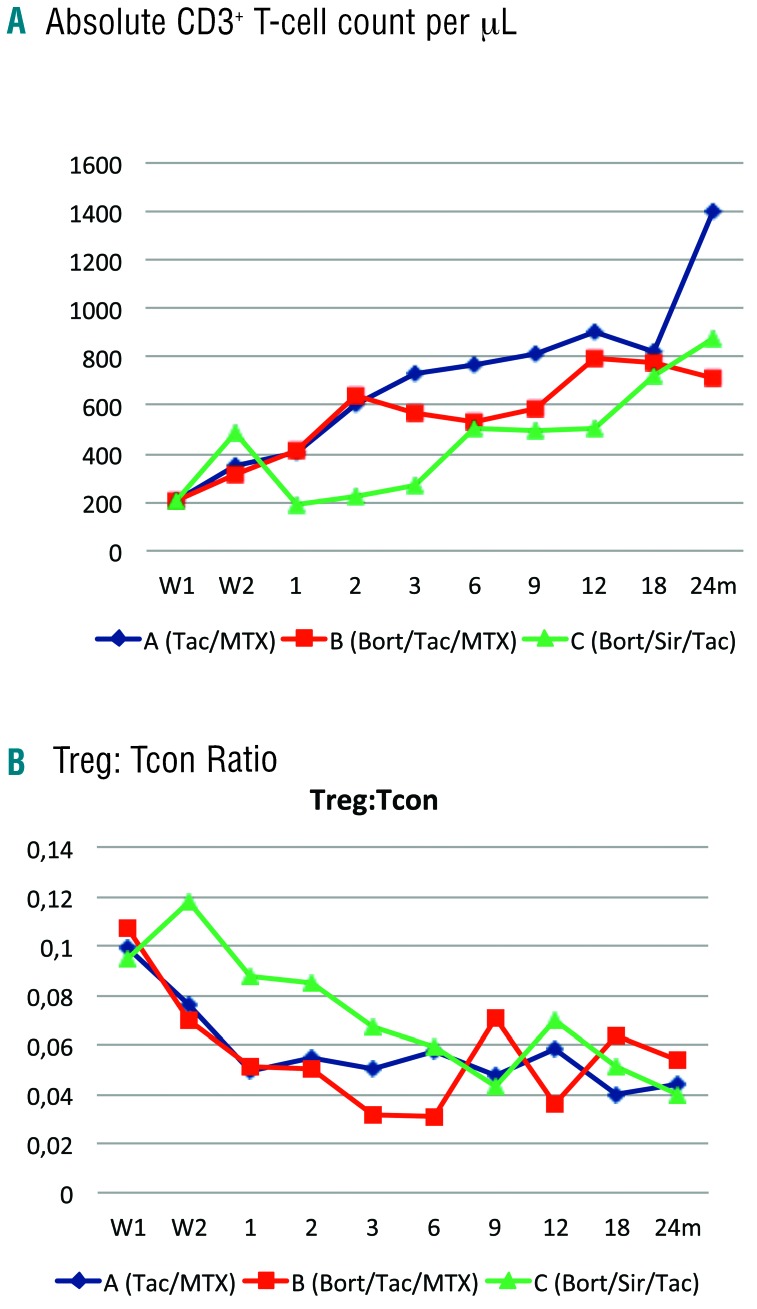
Figure 4.
Immune reconstitution outcomes. Reconstitution of (A) median of absolute CD3+ T-cell count/μL, and (B) median values of CD4+ Treg:Tcon cell ratio per treatment arm. Blue indicates arm A (tac/mtx), red indicates arm B (bort/tac/mtx), and green indicates arm C (bort/sir/tac). Treg: regulatory T cells; Tcon: conventional T cells; Tac: tacrolimus; Mtx: methotrexate; Bort: bortezomib; Sir: sirolimus; W1: week 1; W2: week 2; M: month.

