Fig. 1.
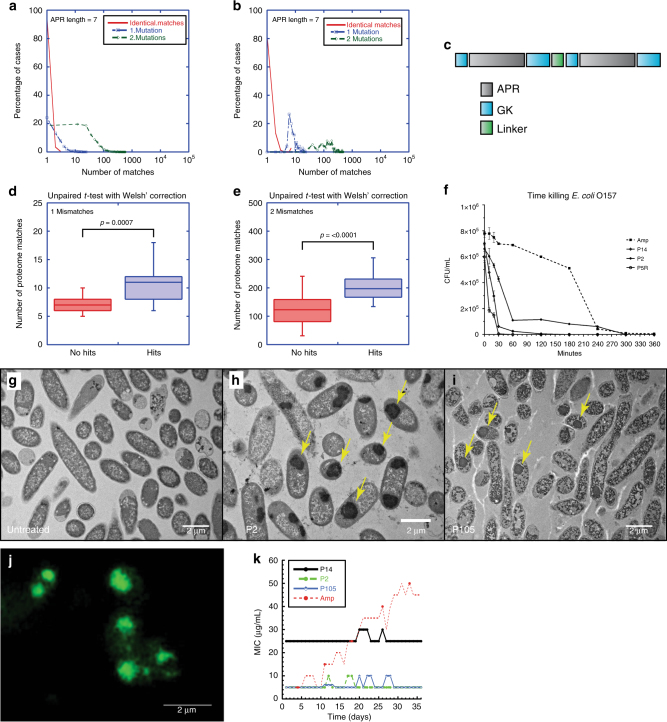
Proteome analysis, design, and screening of redundant APRs. a Distribution of the redundancy of APR sequences of length seven in the E. coli proteome: percentage of identical sequences (red), one mismatch (blue), and two mismatches (green). b Same distribution as in a for the 75 most redundant APRs in E. coli. c Design pattern for aggregating peptide screen. Tandem APRs are linked by a linker (a single proline residue) and embedded between gatekeeper residues (GK; arginine residues). d, e APR redundancy for toxic versus nontoxic peptides considering one (d) or two (e) mismatches. The bottom and top of the boxes are the first and third quartiles, and the band inside the box represents the median. The whiskers encompass the minimum and maximum of the data. Significant differences were computed using Welch’s t test. f Time-killing curve of selected peptides (P14, P2, and P5R) and ampicillin (Amp) against E. coli strain O157:H7 treated at MIC concentration (average and SD of three replicates). g–i Transmission electron microcopy (TEM) of cross-sections of resin-embedded E. coli O157:H7, treated for 2 h with buffer (g), P2 peptide (h), and P105 peptide (i) at MIC concentration. j Wide-field structured illumination microscopy (SIM) image of E. coli O157:H7 treated with P2 and stained with the amyloid-specific dye pFTAA (0.5 µM). k Monitoring of spontaneous buildup of resistance by monitoring the MIC value of E. coli O157: H7 cultures that are maintained on sublethal doses (50% of MIC) of selected peptides (P14, P2, and P105) or ampicillin (Amp) for 36 days

