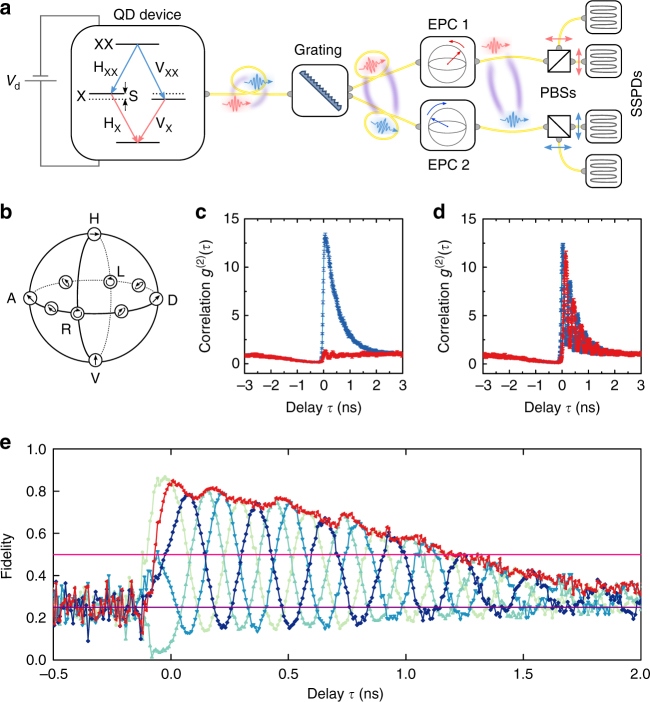
Fig. 2.
Measurement of entanglement fidelity. a Schematic drawing of the entanglement setup. The entangled photons are generated by the biexciton cascade shown diagrammatically in the first panel. X and XX photons are separated by a diffraction grating and sent to their respective polarisation sensitive detection units. These consist of electronic polarisation controllers (EPCs) and polarising beam splitters (PBSs) to prepare the detection system in one of five measurement bases. Polarisation selected photons are measured using superconducting single photon detectors (SSPDs). b Schematic of the Poincaré sphere, with measured bases indicated by cartoons of the photon polarisation. c, d Co-polarised (blue curves) and cross-polarised (red curves) biexciton–exciton photon coincidences measured in the HV and DA bases, respectively. e Entanglement fidelity to four maximally entangled states with phases χ = 0, π/2, π and 3π/2 (light to dark blue curves), as well as to an evolving state (red curve). Pink and purple lines give the classical limit and uncorrelated values for coincidences, respectively

