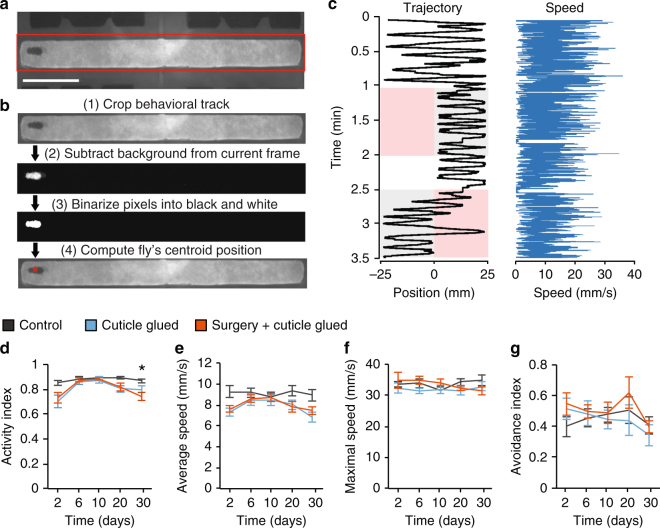
Fig. 3.
Virtually normal locomotor and odor avoidance behaviors for 30 days after surgery. a Behavioral chamber for locomotor and odor avoidance assays, with odor delivery inlets at both sides. Red box: image region-of-interest analyzed to track fly movements. Scale bar: 10 mm. b Fly tracking steps: (1) Isolate the region-of-interest; (2) Subtract the mean background image; (3) Group pixels into background (black) and foreground/object (white) pixels using Otsu’s method and filter objects by size to isolate the fly; (4) Compute fly’s current centroid. c An example of walking trajectory (left) and speed trace (right). Repulsive odor, 4-methyl-cyclohexanol (3% in air), entered first from the left and then the right inlet. Pink indicates these intervals and entry routes; the opposite inlet delivered fresh air (gray shading). Otherwise, both inlets delivered air (white). d Flies that had the full surgery or glue on the cuticle had indistinguishable activity indices from control flies on Days 6 (P = 0.9) and 10 (P = 0.6) (Kruskal–Wallis ANOVA; 10 flies per group). On Days 2 (P = 0.03) and 20 (P = 0.04), the groups exhibited significant differences (n = 8–10 flies per group; Kruskal–Wallis ANOVA), which were insufficient to yield significant paired post-hoc tests between groups (P = 0.06–0.9; U-test with Holm–Bonferroni correction). On Day 30, Kruskal–Wallis ANOVA revealed significant differences between groups (P = 0.02, n = 7–10 flies); post-hoc testing showed surgery group flies had lower activity indices than control flies (P = 0.02; U-test with Holm–Bonferroni correction). *P < 0.05. e Flies that had surgery or glue on the cuticle had indistinguishable mean locomotor speeds from control flies on Days 6–20 (P = 0.1–0.9; Kruskal–Wallis ANOVA; n = 8–10 flies per group). On Days 2 and 30, the groups exhibited significant differences (P = 0.03, Day 2, P = 0.04, Day 30; Kruskal–Wallis ANOVA; n = 7–10 flies per group), which were insufficient to yield significant paired, post-hoc tests between groups (P = 0.05–0.6; U-test with Holm–Bonferroni correction). f, g Maximal walking speeds (f) and odor avoidance indices (g) were indistinguishable between groups for 30 days (P = 0.2–0.9 for all comparisons of walking speeds and odor avoidance indices; n = 7–10 flies per group; Kruskal–Wallis ANOVA). Error bars: s.e.m.

