Fig. 5.
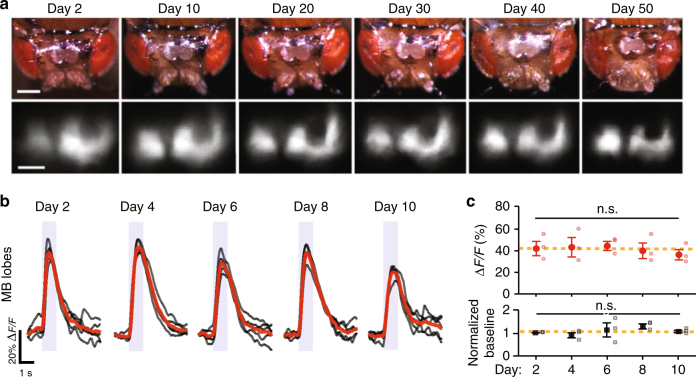
Long-term in vivo imaging of neural Ca2+ activity. a Example images of the surgically created imaging window (upper panels) and fluorescent mushroom bodies expressing the Ca2+ indicator GCaMP6f in OK107-GAL4>20×UAS-GCaMP6f flies (lower panels). The imaging window was transparent across the 50-day interval, and GCaMP6f expression appeared stable across this period. Scale bars are 200 µm (upper panels) and 100 µm (lower panels). b Example traces of odor-evoked neural Ca2+ activity in the mushroom body of an OK107-GAL4>20×UAS-GCaMP6f fly. Gray traces: individual trials (n = 5). Red traces: mean responses. Shaded intervals: periods of olfactory stimulation (1 s duration) with 2% ethyl acetate. c Peak amplitudes of odor-evoked Ca2+ activity (upper) and normalized levels of baseline fluorescence (lower) in the mushroom body were both stable for 10 days (P = 0.4 and 0.3 for upper and lower panels, respectively; Friedman ANOVA; n = 3 female OK107-GAL4>20×UAS-GCaMP6f flies). Closed data points denote mean values, and open data points mark values for individual flies. We normalized the baseline fluorescence levels in each fly to their values on Day 2. Error bars are s.e.m. Yellow dashed lines denote mean values averaged over all 10 days

