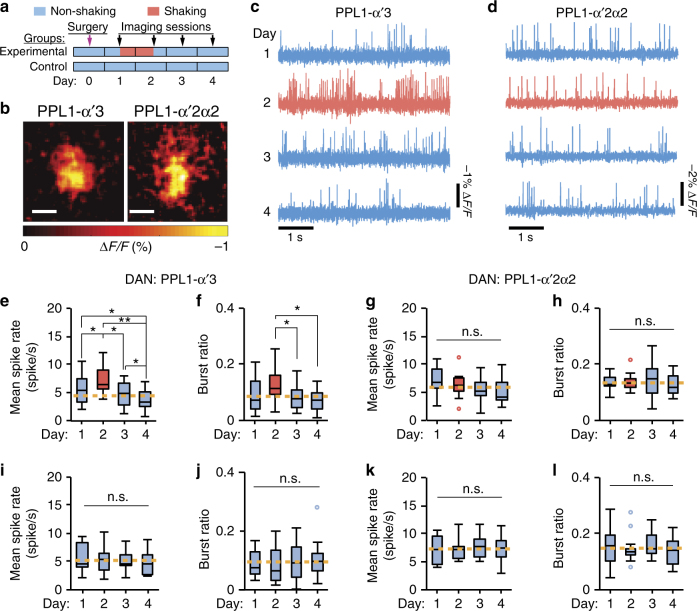
Fig. 7.
Spontaneous spiking responds differently to mechanical stress in PPL1-α‘3 versus PPL1-α‘2α2 dopaminergic neurons. a Timeline: Laser surgery on Day 0, then daily voltage imaging for 4 days. From noon on Day 1, experimental but not control flies underwent 24 h of ongoing shaking. We performed three separate 10-s recordings per session per fly. We averaged spiking metrics for each fly across these three recordings; using the resulting mean values, we computed the box-and-whisker elements in e–l. b Spatial maps of mean fluorescence response (ΔF/F) at the spike peak in axonal regions of a PPL1-α’3 neuron in a MB304B-GAL4>20×UAS-Ace2N-2AA-mNeon fly (left) and a PPL1-α’2α2 neuron in a MB058B-GAL4>20×UAS-Ace2N-2AA-mNeon fly (right), averaged over 140 and 113 spikes, respectively. Scale bars: 10 μm. c Activity traces of a PPL1-α’3 neuron, showing increased spiking after shaking (Day 2). d Activity traces of a PPL1-α’2α2 neuron, showing normal spiking after shaking. e, f Spiking rates (e) and burst ratios (f) of PPL1-α’3 neurons were elevated after shaking and then declined below baseline on Day 4 (P = 4 × 10⁻⁴ in e, P = 0.01 in f; n = 15 flies; Friedman ANOVA; *P < 0.05, **P < 0.01 post-hoc Wilcoxon signed-rank test with Holm–Bonferroni correction). We computed the burst ratio as the number of spikes in a cell’s activity record occurring <20 ms after the preceding spike, divided by the total number of spikes in the record. g, h Spiking rates (g) and burst ratios (h) of PPL1-α’2α2 neurons were unaffected by shaking (P = 0.05 in g, P = 0.9 in h; n = 13 flies; Friedman ANOVA). i, j In control flies, spiking rates (i) and burst ratios (j) of PPL1-α’3 neurons were stationary (P = 0.9 in i, P = 0.5 in j; n = 15 flies; Friedman ANOVA). k, l In control flies, spiking rates (k) and burst ratios (l) of PPL1-α’2α2 neurons were stationary (P = 0.8 in k, P = 0.3 in l; n = 13 female flies; Friedman ANOVA). Yellow dashed lines: mean values averaged across all days without shaking. Box-and-whisker plots are formatted as in Fig. 6

